TURKEY 10 YEAR BOND YIELD

TURKEY 10 YEAR BOND YIELD I

TURKEY 10 YEAR BOND YIELD II

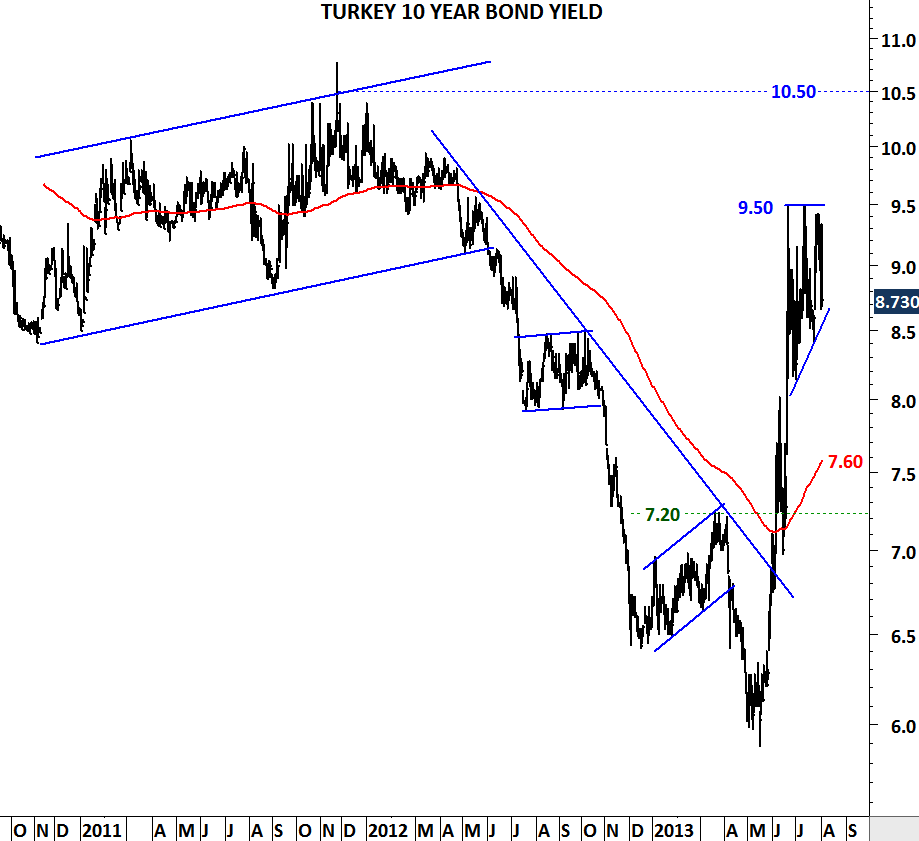
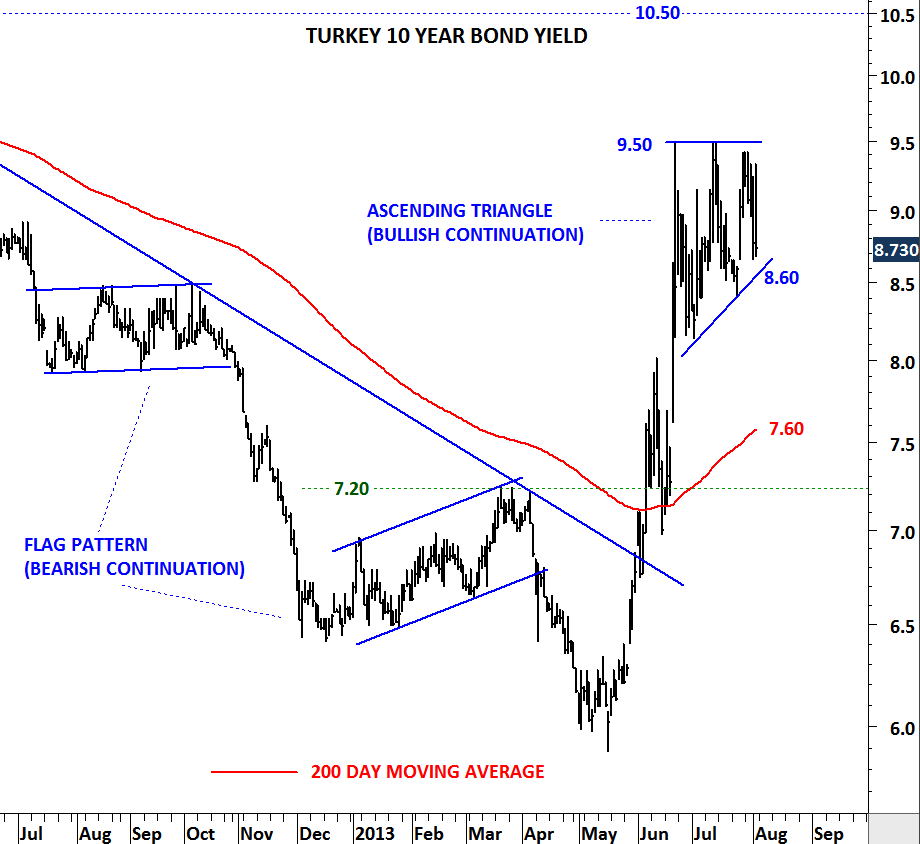
May 2013 recorded the low for the Turkish 10 year government bond yields. Year-long downtrend was reversed with the breakout above 7.2 levels. Yields broke above 1) downward sloping trend line at 7.0 2) flat horizontal resistance at 7.2 and 3) 200-day moving average at 7.1. Sharp rally carried the yields to 9.5 levels. Since the beginning of July, 9.5 has been short-term resistance. However, chart formation (ascending triangle) suggests higher yields towards 10.5 levels unless we see a breakdown below 8.6 levels in the coming days/weeks. For the time being 10 year bond yields are in a short-term consolidation. Technical outlook is positive for the yields and negative for the bonds, as the 10 year yield established its uptrend above the 200-day moving average. During any pull back strong 7.60-8.60 area will act as strong support. Breakout above 9.5 levels will target 10.5 in the short-term.

THAILAND SET INDEX

THAILAND SET INDEX

USDTHB

Emerging market equities are challenging their long-term moving averages. Breakdown below these critical long-term support levels could result in sharp corrections. Since the first quarter of 2013 we have seen weakness in emerging market currencies and their equity indices. Thailand was one of the best performing emerging market over the past 4 years. Though a correction could be as sharp as the upward trend. SET Index is now testing the 4 year-long trend line support and the 200-day moving average. Breakdown below these strong support levels could result in a deep correction towards 1,100 levels. USD/THB is already off its lows and well above its 200-day average. Strong support area for the USD/THB is between 30.4 and 30.8. Current technical outlook is negative for Thai Baht and the Thailand SET Index. Unless the equity index recovers above 1,500 levels, downward pressure will remain intact.

XU 30 INDEX – (TURKEY)

BIST 30

Is this a base formation or a short-term consolidation before the major break down and the resumption of the downtrend? Turkey’s XU 30 Index is holding above its 5 year-long uptrend and a break below 85K could turn into a sharp correction. Latest consolidation below the 200 day moving average has been weak and the counter trend moves had difficulty to close the gap between 100K and 105K. It is important to note that the index is testing its long-term trend for the 4th time over the analyzed period and a breakdown below this strong support will signal further downward pressure. Technical outlook would turn bullish only if the index recovers above 95K levels which is the 200 day moving average.

USD/MYR (U.S. DOLLAR/MALAYSIAN RINGGIT)

USDMYR

After a long break on markets (as I have been enjoying being a father for the first time) I’m back with a blog update on an exciting range breakout in the emerging asia currencies. USD/MYR is trying to breakout from a 2 year-long consolidation range. This pair has been on my watch list for some time. I like these type of flat range breakouts. In this example USD/MYR moved between 3.00 and 3.20 levels for almost two years and over the same time period the crossrate tested 3.20 levels for 4 times. We can see that with this week’s price action, USD/MYR is challenging the same resistance. A decisive weekly close above 3.20 will confirm the breakout and push the crossrate towards 3.30-3.35 area. For the bullish outlook to remain intact USD/MYR should hold above 3.20 levels in the following weeks.

USD/TRY

USDTRY

It is uncharted territory once again for the USD/TRY. For more than a decade USD/TRY (U.S. dollar/Turkish lira) consolidated between 1.75 and 1.15 levels. Cross rate managed to stabilize for more than a decade after the inflationary years of 1990s. It was mid-2011 when the USD/TRY breached the decade-long resistance at 1.75 levels. First the cross rate reached 1.92 levels and then pulled back to 1.75. Short/medium-term consolidation formed a bullish flag and in May we have discussed the possibility of a strong breakout. Breakout above 1.83 was followed by a sharp upward move. Emerging market currencies are weakening against the U.S. dollar. Turkish lira is one of them. Price, breaking to a new all time high increases the risk of further depreciation towards 2.0 levels. Medium-term stop-loss area becomes 1.75-1.83. With the medium-term stop-loss area in place, we can expect higher USD/TRY in the following weeks.

XU30 INDEX – (TURKEY)

XU30

It’s been an eventful month so far in Istanbul. Anti-government protests resulted in a sharp sell-off in Borsa Istanbul. Protests can continue for sometime and markets can stay volatile. While it is difficult to understand the price action during these type of event-driven markets, support/resistance levels could be helpful in managing risk. XU 30 index slipped below its long-term (200 day) average at 97,200. This was also the lower boundary of the upward trend channel. Failure to push above the long-term average will be a clear sign of weakness and could result in further downward pressure towards 76,000-91,500 range. The uptrend that has been intact since the beginning of 2012 is damaged and for us to discuss positive price action and improving technical outlook, the index should breach above 97,200 levels in the following weeks.

WTI CRUDE OIL

WTI CRUDE OIL

We are likely to see a strong breakout on crude oil in the following days/weeks. Strong resistance is at $97 levels. Downward sloping trend line which acts as strong resistance was tested for five times over the past one year. Breakout from the short/medium-term symmetrical triangle will push prices higher towards $104. This is one of the important charts to follow in the following days/weeks.

U.S. JOBLESS CLAIMS

US JOBLESS CLAIMS

US UNEMPLOYMENT RATE

Today we will update our jobless claims data. Since 2009, U.S. jobless claims have been declining from 650K levels to 350K. This has been a strong downtrend and reached levels that proved to be major support over the past decades. 300-350 area is strong support. Higher jobless claims data over the next few months could signal a major turning point that could result in weak job market. Currently unemployment rate stands at 7.5%.

USD/RUB (U.S. DOLLAR/RUSSIAN RUBLE)

USDRUB

Russian ruble is another emerging market currency that has lost ground against the U.S. dollar. Over the past 9 months cross rate completed an inverted head and shoulder pattern with the neckline acting as resistance at 31.80 levels. Inverted head shoulder is regarded as a bullish reversal pattern. We are now seeing USD/RUB breaking above the resistance at 31.80 levels. With a stop-loss slightly below 31.80 we should follow this cross rate to move higher favoring U.S. dollar. Inverted head and shoulder price target will be 33.70 in the medium-term.

USD/ZAR

USDZAR

U.S. dollar continues to gain strength against major emerging market currencies. In this update I’m analyzing the USD/ZAR (South African Rand). USD has been strong against the Rand since mid-2011. We are now seeing the uptrend accelerating towards the long-term resistance at 10.70 levels. Earlier tops in 2001 and in 2008 was marked with an upward spike. 10.70 is the likely short-term target.