EUR/USD & GBP/USD

EURUSD

GBPUSD

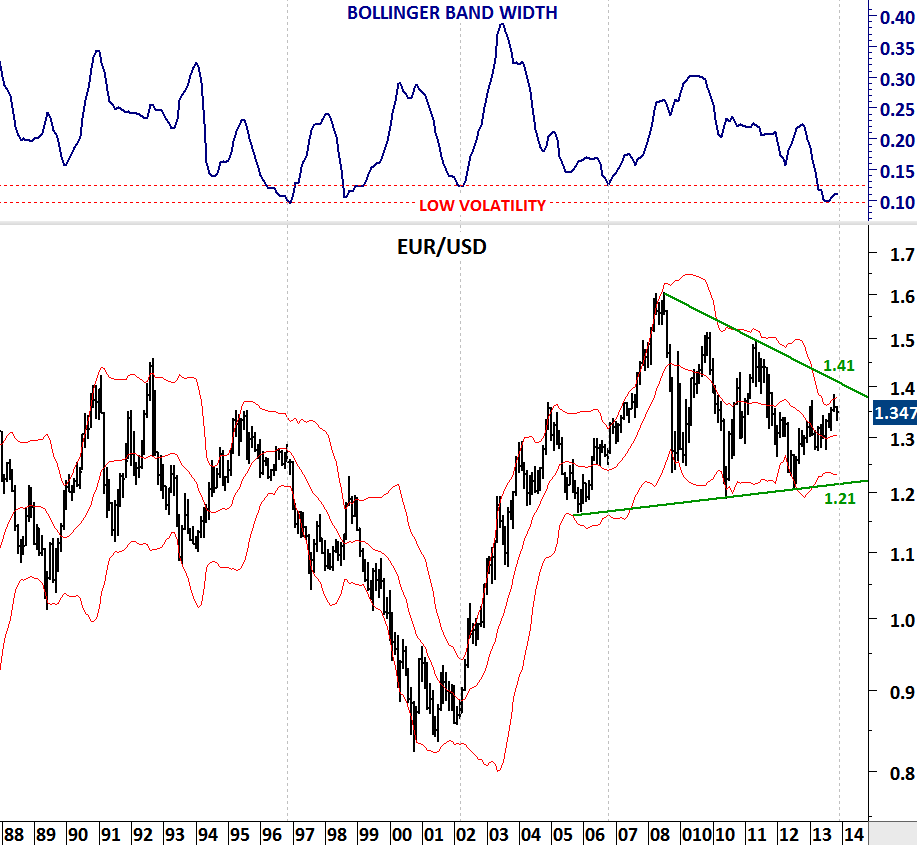
If you think that currencies have been volatile, you haven’t seen anything yet. We are likely to see more volatility and read about “currency wars” in the following months. These two charts are extremely powerful and suggest both cross rates are at an extreme low volatility period when compared with the past few decades. Volatility is cyclical and low volatility is usually followed by high volatility and vice versa. Both EUR/USD and GBP/USD are getting closer to a major breakout that will be followed by multi-month trend periods. These are very long-term charts and are presented to show that actually we are at a low volatility period. Levels to watch in the long-term for EUR/USD: (resistance: 1.41, support: 1.21) for GBP/USD: (resistance: 1.65, support: 1.50).

ITALY MIBTEL & SPAIN IBEX 35

ITALY FTSE MIBTEL INDEX

European equities recover from the bear market by first clearing their 200-day moving averages and then by breaking to new high levels. Two indices that have shown considerable strength over the past few months are Italy’s MIBTEL and Spain’s IBEX 35. Italy FTSE MIBTEL started gaining momentum after the breakout above 17,700 levels. Uptrend is intact and the index just completed a minor consolidation in the larger scale uptrend. We can expect the index to resume its uptrend in the following weeks.

SPAIN IBEX 35 INDEX

Spain’s IBEX 35 index gained strength after breaking out of its year-long sideways consolidation at 8,800 levels. Similar to Italy’s MIBTEL index, Spain’s IBEX 35 just completed a minor sideways consolidation which is expected to be part of a larger scale uptrend. Both indices have positive technical outlook and should target higher levels in the following months.

10 YEAR U.S. TREASURY YIELDS

10 YEAR US YIELDS

Yields are rising once again putting pressure on the bond market. U.S. 10 year Treasury yield doubled since mid-2012 and now it is close to strong trend resistance between 2.9-3.0 levels. 200-day moving average which is at 2.4 levels is acting as medium/long-term support. Unless 10 year U.S. yield breaks down 2.4 levels in the following weeks we can expect higher prices that could eventually clear the 6 year-long trend line resistance at 3.0 levels. Technical outlook is positive and suggest higher yields in the following weeks/months.

US 5 YEAR NOTES

U.S. 5 year treasury note completed a pull back after breaking down strong trend support in the first half of 2013. Unless price moves above 122 levels we should expect lower bond prices in the following weeks. Technical outlook is negative.

TECH TRADE

COPPER

Copper prices might be forming a medium-term base at these levels. Confirmation of the base formation will be a decisive breakout above 3.4 levels. Chart pattern suggests an inverted head and shoulder might be close to completion once price clears 3.4 levels. MACD is trying to reverse from 0 levels (bullish) and price is challenging the 200 day moving average. On the weekly scale 3.0 levels acted as strong support after price tested it for three times over the past two years. Until we see a decisive breakout above 3.4 levels technical outlook should remain neutral. Above 3.4 levels price will target 3.7 levels and the technical outlook will turn to positive.

Weekly price chart of COPPER

COPPER weekly

Daily price chart of COPPER

COPPER daily

TECH TRADE

U.S. JOBLESS CLAIMS

US WEEKLY JOBLESS CLAIMS

After four years of strength in employment figures, weekly jobless claims found support at multi-year low around 300K. Weekly jobless claims reversed from 280K-300K area in 1989, 2000 and 2006. Similar reversal might be in place as we enter the last quarter of 2013. Jobless claims already experienced a sharp rebound over the past few weeks and as long as it stays above 280K-300K area we could see weak employment figures in the coming months. Today’s number came in at 358K and this is clearly above the strong support area. Earlier analysis on the jobless claims can be found here (August 9, 2013 , June 6, 2013)

COCOA

COCOA

COCOA daily

Cocoa moved higher after its breakout from the base formation – a cup with handle. This chart pattern is usually regarded as bullish and a breakout above the horizontal resistance suggest higher prices. Price target is calculated by adding the width of the formation to the breakout level. In the beginning of August (August 8, 2013), I’ve analyzed Cocoa prices and drew attention to the breakout and calculated a price target of 2,800. Since then prices have climbed higher and reached the formation price target.

Cocoa can slow down at these levels but a breakout above this flat resistance could send prices higher resulting in a similar uptrend that took place between 2007 and 2008.


DOW JONES INDUSTRIAL & US 5 YEAR T-NOTE

Dow Jones Industrial Average pulls back to its long-term 200 day moving average. This is also the 5 year-long trend line support. At this point I see the market oversold. Strong support area is between 14,300 and 14,500. It is important to note that Dow Jones Industrial Average has been trading in a wide range between 14,500 and 15,500 over the past 4 months. It is now close to the lower side of that range.

U.S. 5 year T-Note completed a pullback to the broken trend support. Both trend line and the 200 day moving average are forming strong resistance between 122 and 123 levels. Unless we see prices breaching 123 levels, trend direction will be downwards.

TECH TRADE