COCOA
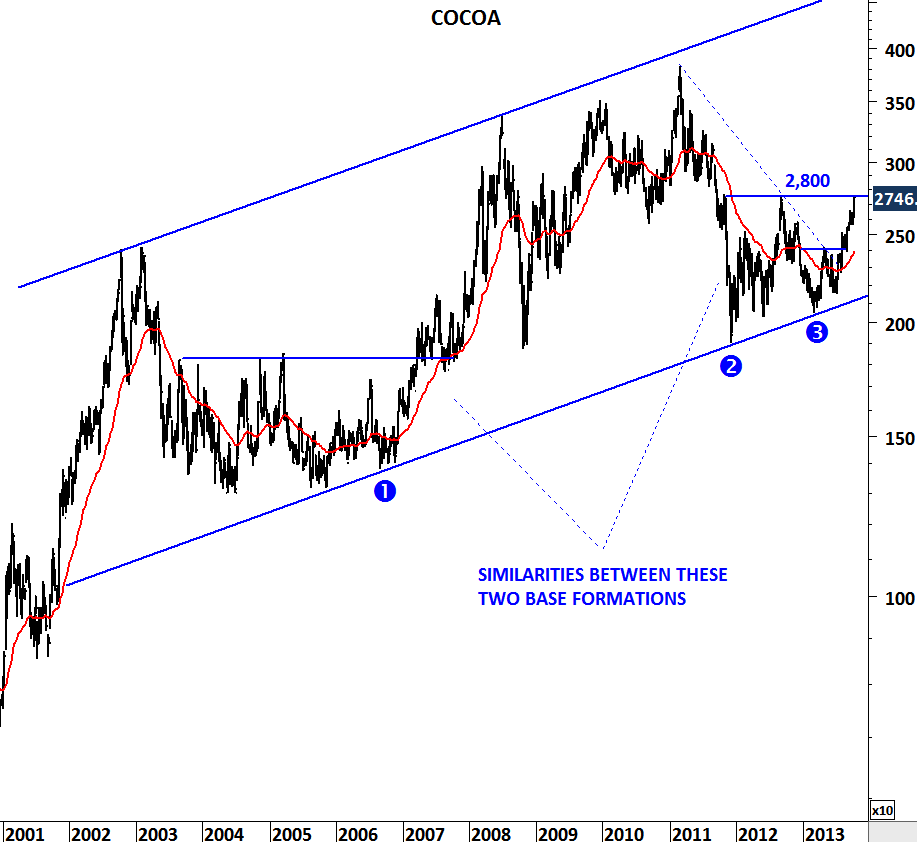
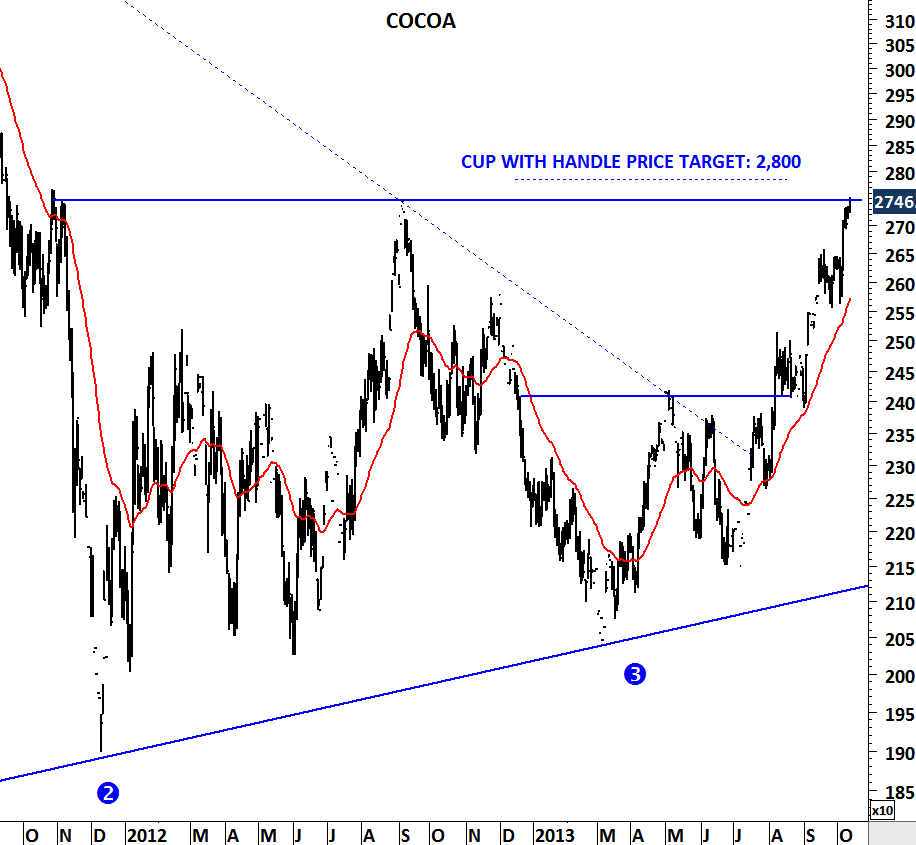
Cocoa moved higher after its breakout from the base formation – a cup with handle. This chart pattern is usually regarded as bullish and a breakout above the horizontal resistance suggest higher prices. Price target is calculated by adding the width of the formation to the breakout level. In the beginning of August (August 8, 2013), I’ve analyzed Cocoa prices and drew attention to the breakout and calculated a price target of 2,800. Since then prices have climbed higher and reached the formation price target.
Cocoa can slow down at these levels but a breakout above this flat resistance could send prices higher resulting in a similar uptrend that took place between 2007 and 2008.

