Japan, Norway, US, Turkey, Italy, France
Here are some of the exciting charts that I shared on twitter @TechCharts. I’m attaching the twitter feeds for those who are following the blog but not twitter. More will be posted soon under the new category of Tech Trade. Tech Trade will include low volatility chart set-ups and widely followed chart patterns.
RENAULT (RENA.PA) low volatility set-up and a 5 month-long sideways consolidation. #CAC40 #FRANCE pic.twitter.com/J0oFc3G0M8
— Aksel Kibar, CMT (@TechCharts) October 5, 2013
FIAT (FIA.MI) forms ascending triangle in an uptrend. Bullish outlook if it clears 6.5 levels. #ITALY #MIBTEL pic.twitter.com/lz9OOSpiky
— Aksel Kibar, CMT (@TechCharts) October 5, 2013
Questerre Energy (QEC.OL) breakout from a long-term base formation. Bullish technical outlook above 6.75 #OBX #NORWAY pic.twitter.com/BULn5fG2yK
— Aksel Kibar, CMT (@TechCharts) October 5, 2013
JDS UNIPHASE $JDSU forms 2 year-long base formation. Bullish above 15.50. Flat range breakouts are powerful #NASDAQ pic.twitter.com/1TuI276vr0
— Aksel Kibar, CMT (@TechCharts) October 5, 2013
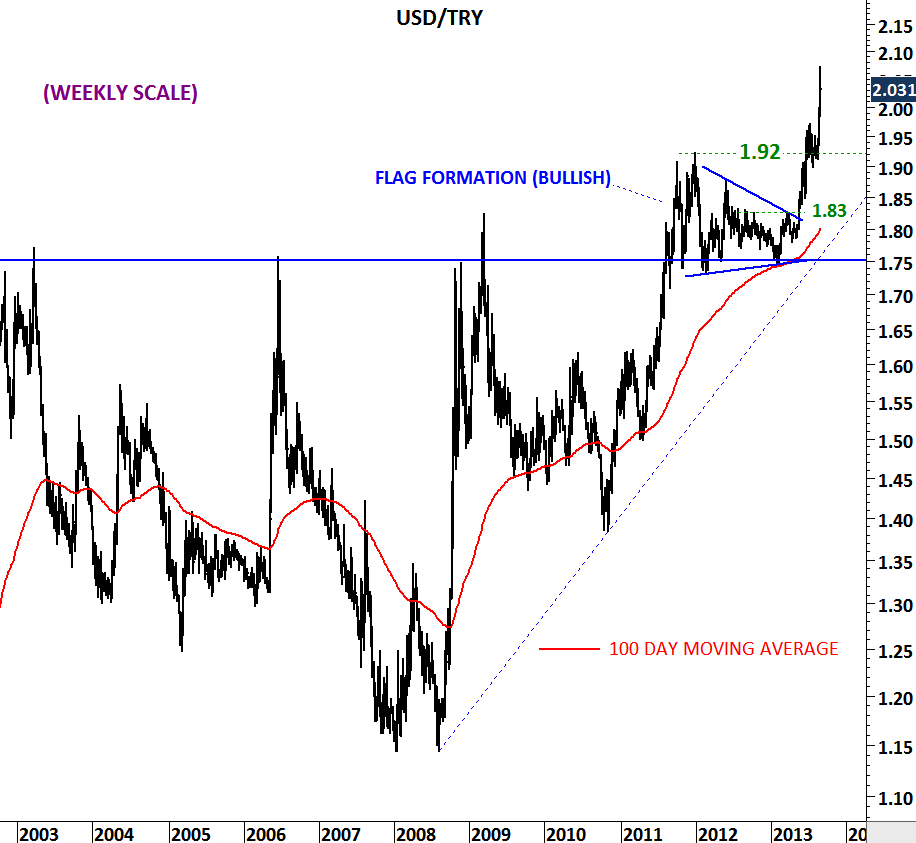
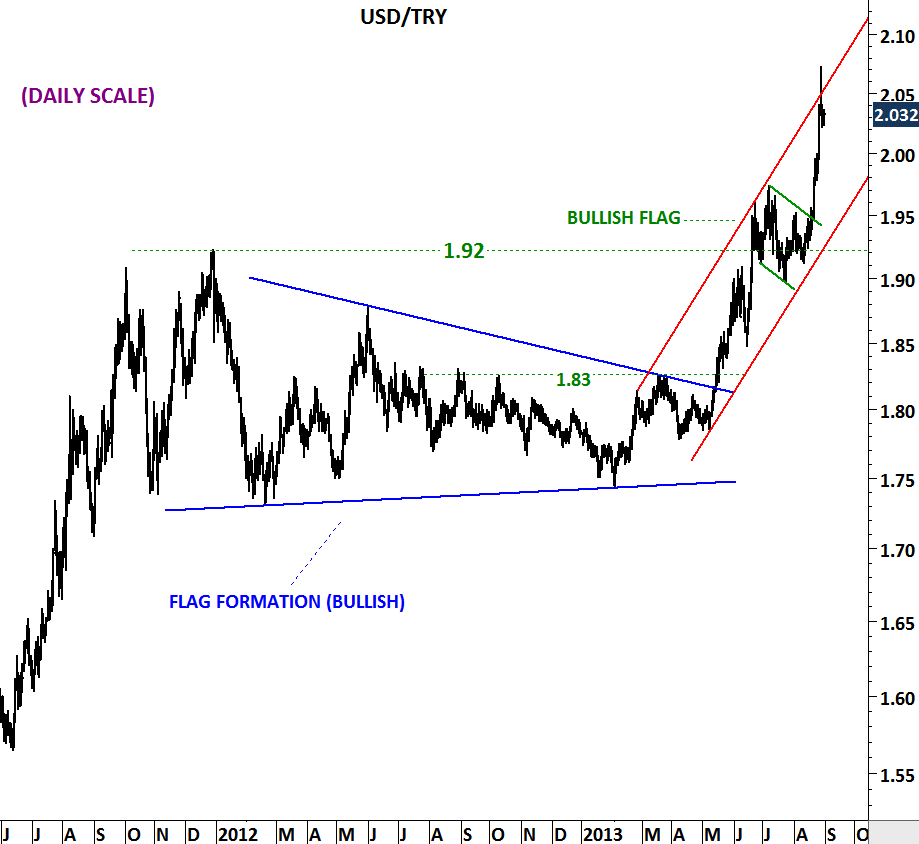
It is still too early to call for directional change on #USDTRY Uptrend remains intact with strong support levels. pic.twitter.com/T5Bn1SR1Rn
— Aksel Kibar, CMT (@TechCharts) October 5, 2013
Volatile #USDTRY is still in an uptrend and has strong support levels. For the uptrend to reverse #USDTRY should break 1.98, 1.94 and 1.92
— Aksel Kibar, CMT (@TechCharts) October 5, 2013
Toyota Industries (6201.T) tests the lower boundary of its consolidation. Another symmetrical triangle #NIKKEI #JAPAN pic.twitter.com/7zeTx3CI62
— Aksel Kibar, CMT (@TechCharts) October 5, 2013
Sony Corp. (6758.T) prepares for a breakout. Sym. triangles in an uptrend are considered to be continuations. #NIKKEI pic.twitter.com/VkPUHrkF3Q
— Aksel Kibar, CMT (@TechCharts) October 5, 2013
JGC Corprotation (1963.T) symmetrical triangle suggest a strong breakout in the following days #JAPAN #NIKKEI pic.twitter.com/yYHQRMGCf7
— Aksel Kibar, CMT (@TechCharts) October 5, 2013
Will Japanese equities resume uptrend? Several bullish chart patterns on Japanese equities suggest higher possibility of a strong year end
— Aksel Kibar, CMT (@TechCharts) October 5, 2013