INDIA BOMBAY SE SENSEX INDEX

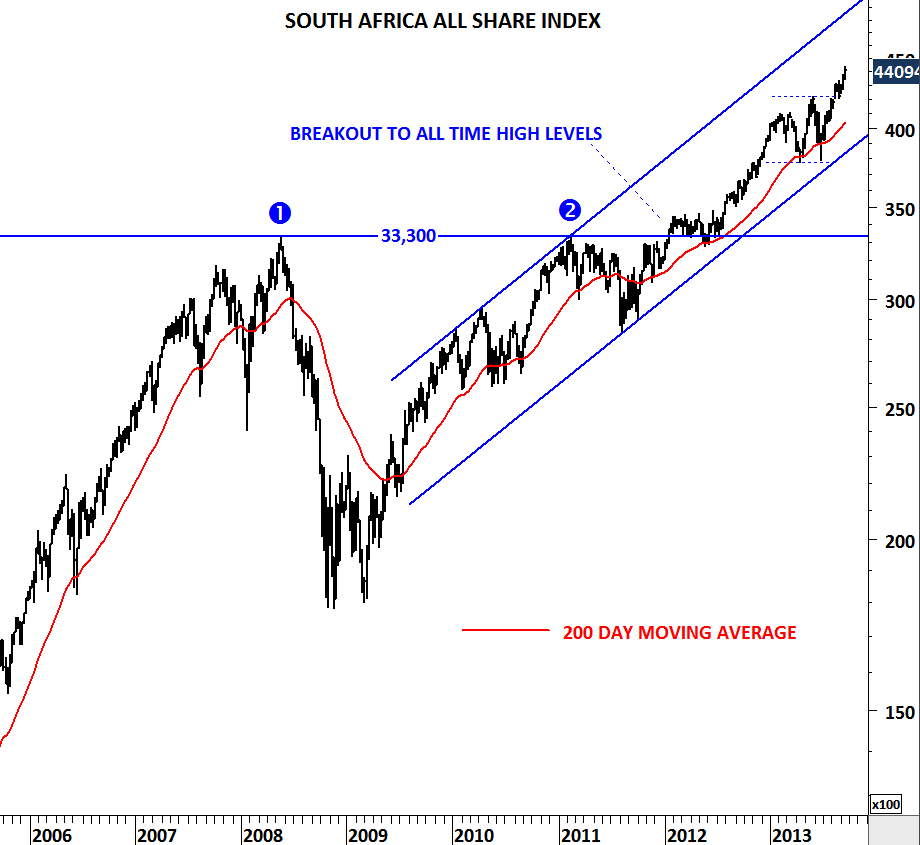
It has been a difficult month for the emerging market currencies and especially for the Indian Rupee. Sharp depreciation of the currency and rising yields have caught the attention of the mainstream media. Tech Charts frequently updated the outlook on the rupee starting from 55 levels. While the Indian currency had a sharp depreciation, equities held well and moved in the opposite direction. India’s Sensex index is now closer to its historical high levels which is a strong multi-year resistance at 21,250 levels. This level was tested in the beginning of 2008 and 2011 and held as strong resistance. Breakout above 21,250 levels will be extremely bullish for the Indian equity market. Such breakout to historical high levels occurred in the South African All Share Index back in 2012 and resulted in a sharp multi-month rally. Due to its similarity in technical action I’m posting a chart on the South Africa All Share Index. In the following weeks we should watch 21,250 levels on the Sensex.