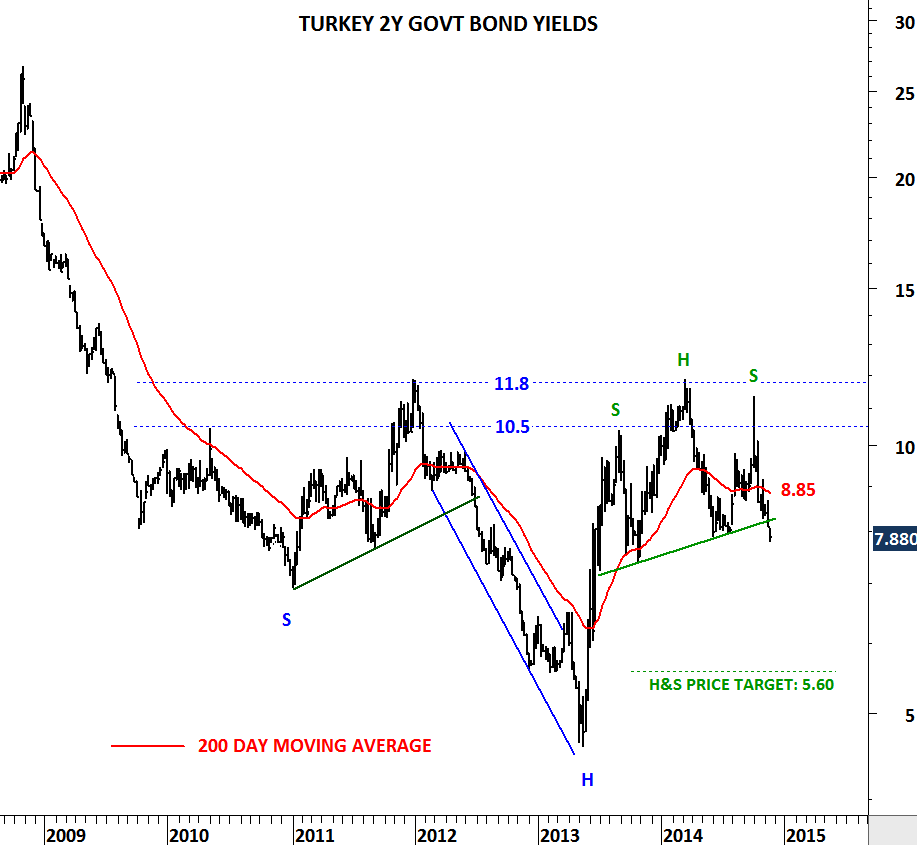
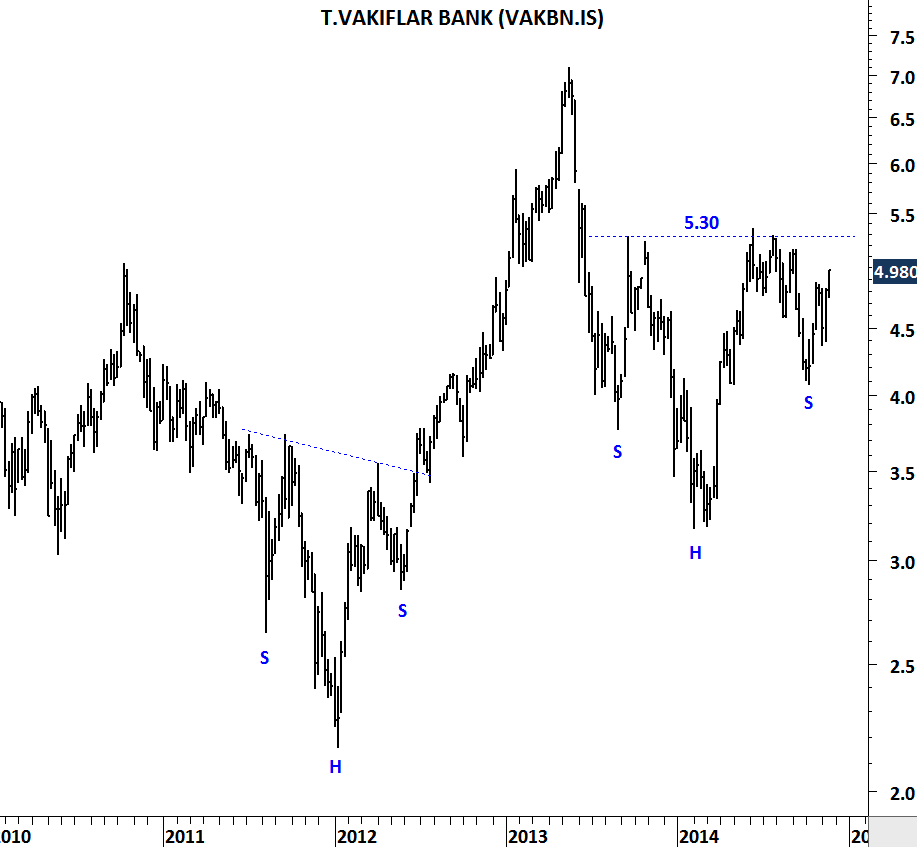
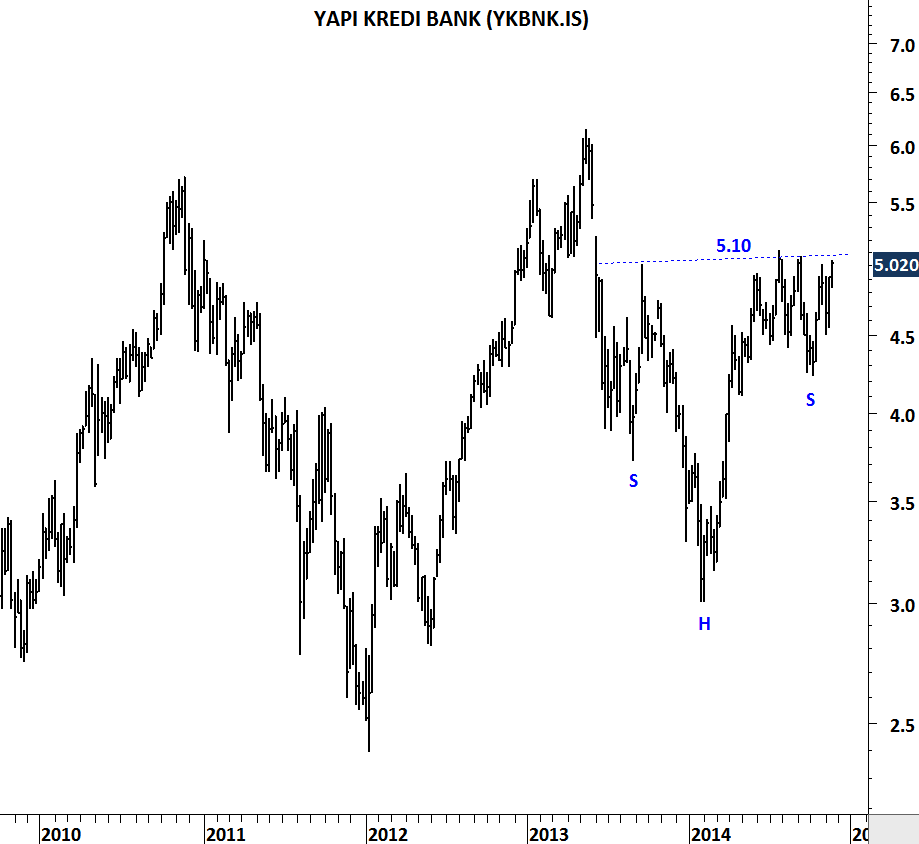
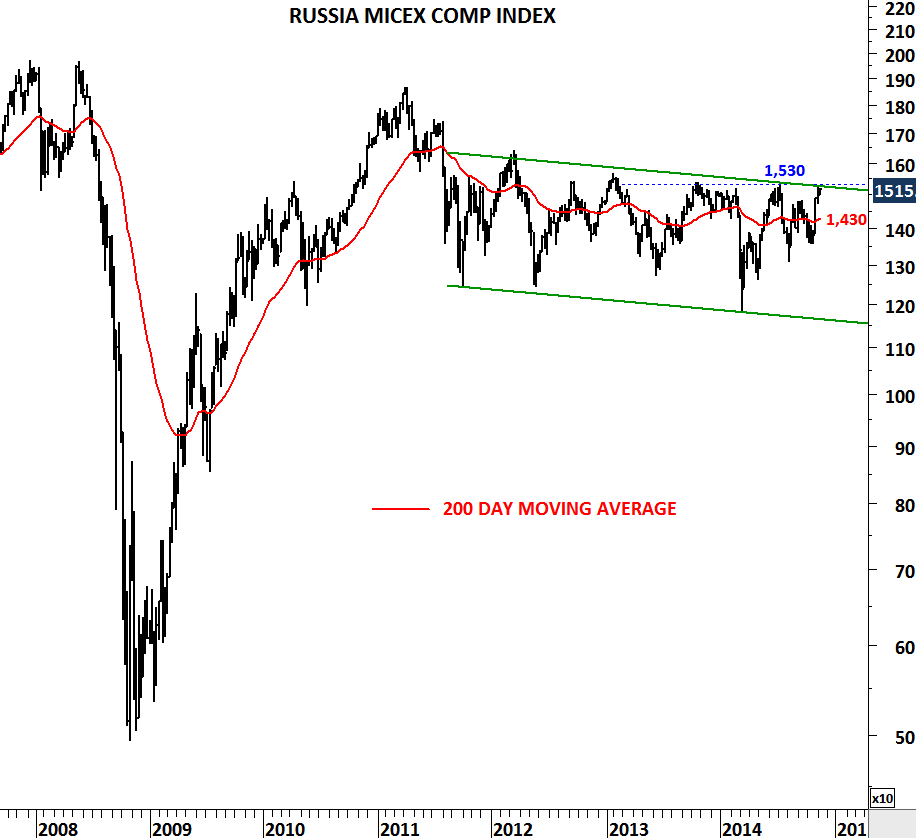
USD/RUB (U.S. DOLLAR/RUSSIAN RUBLE)

USDRUB

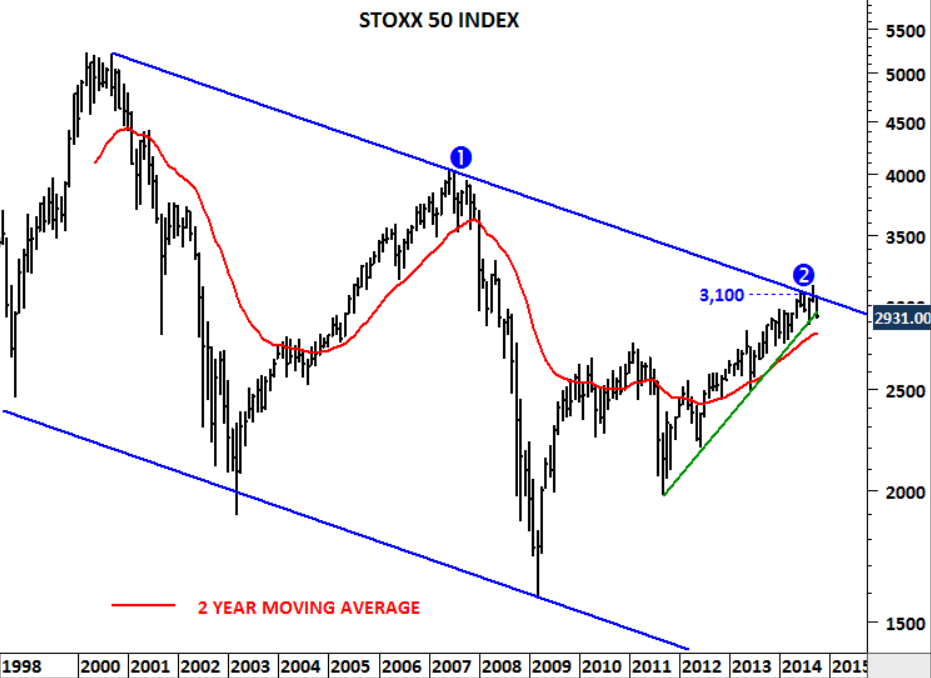
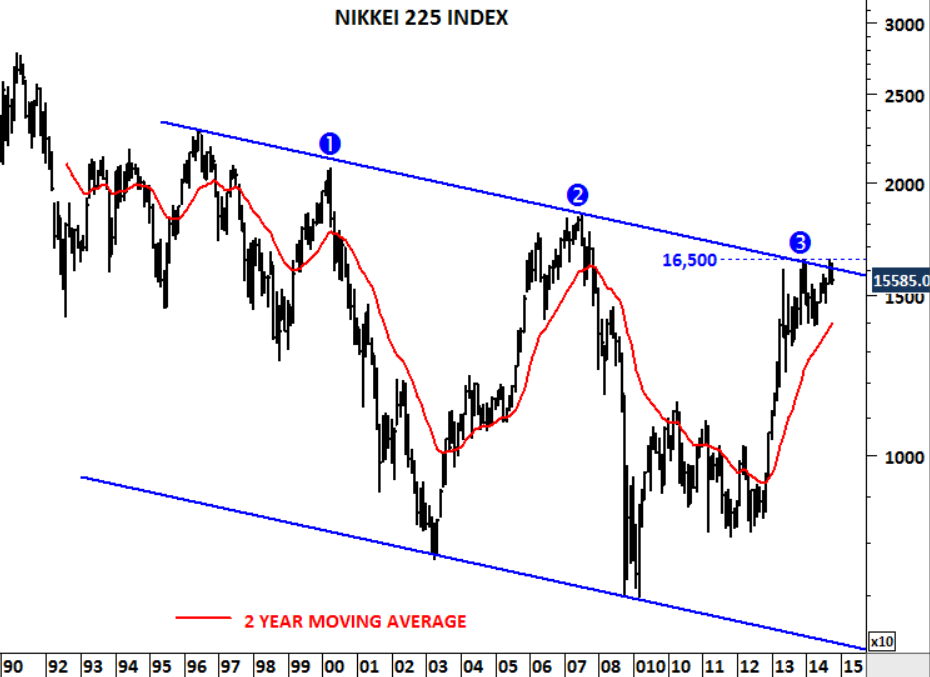
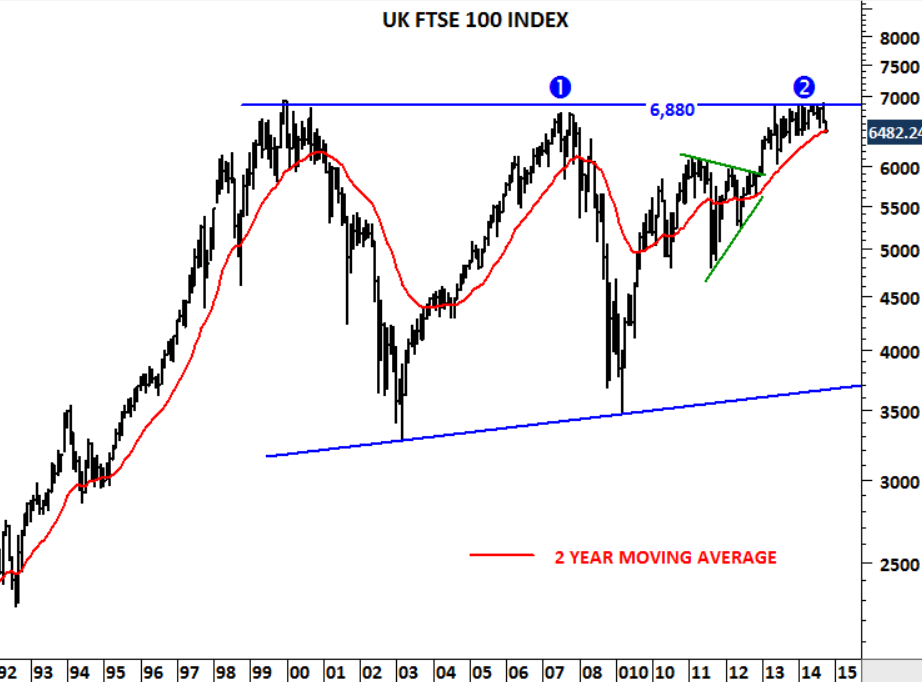
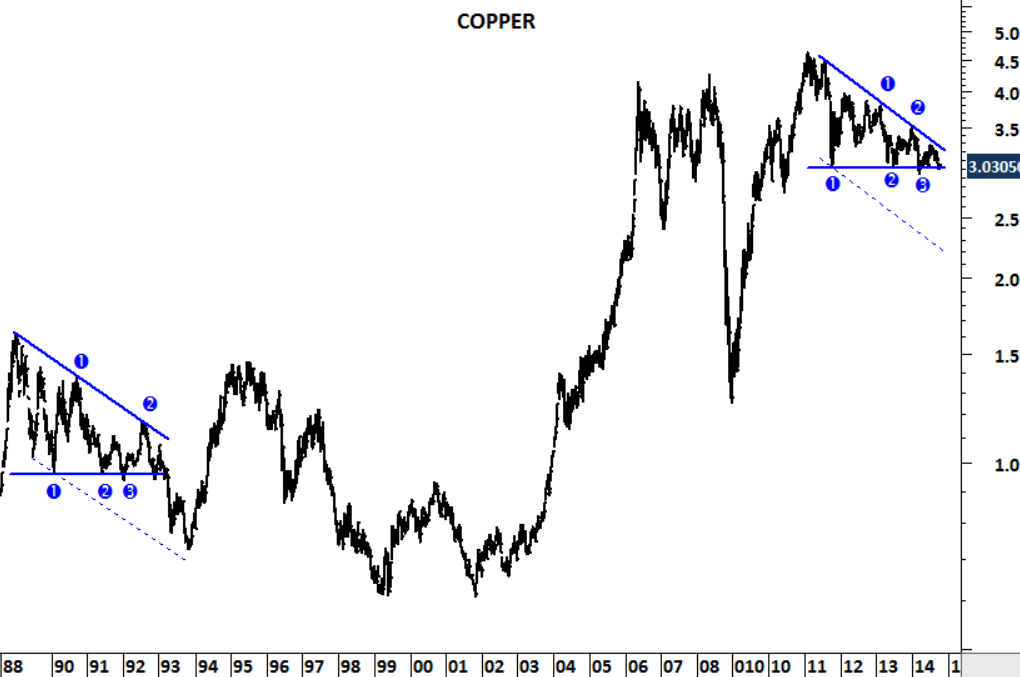
Parabolic moves are not sustainable. They are also not easy to trade. It is costly to pick a top or a bottom. Price usually doesn’t stop where we think it would stop. However as a chartist I feel the urge to bring such imbalances to your attention. Whatever the instrument, these type of price movements are the perfect case studies to examine crowd psychology. USD/RUB entered into a parabolic move after breaking above 36.50 – historical high level. Sharp reversals are experienced after such steep price actions. In the past, similar price movements took place on few other charts.

USDKES

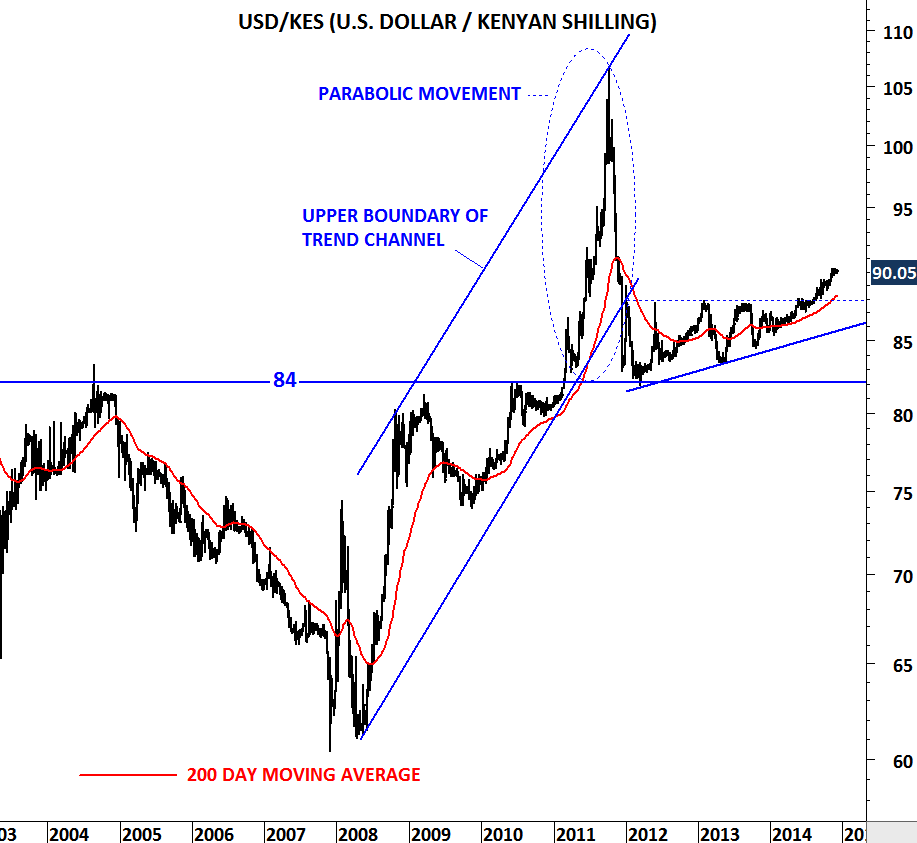
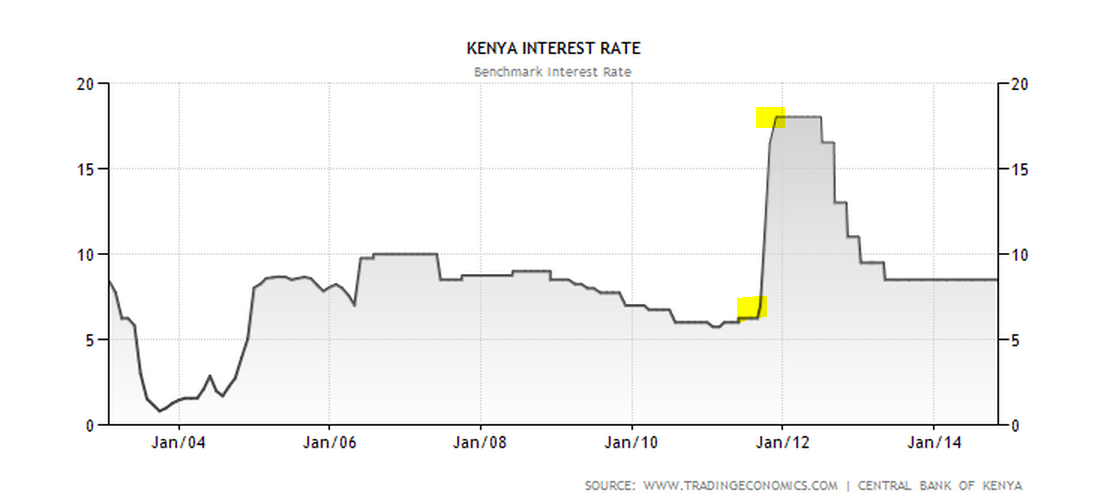
In 2011, USD/KES (U.S. DOLLAR/KENYAN SHILLING) had a similar long-term breakout followed by a 8 month-long parabolic move. Steep price action was reversed by Central Bank of Kenya’s bold action to raise interest rates from 6 percent to 18 percent in less than a year.

KENYA INTEREST RATES

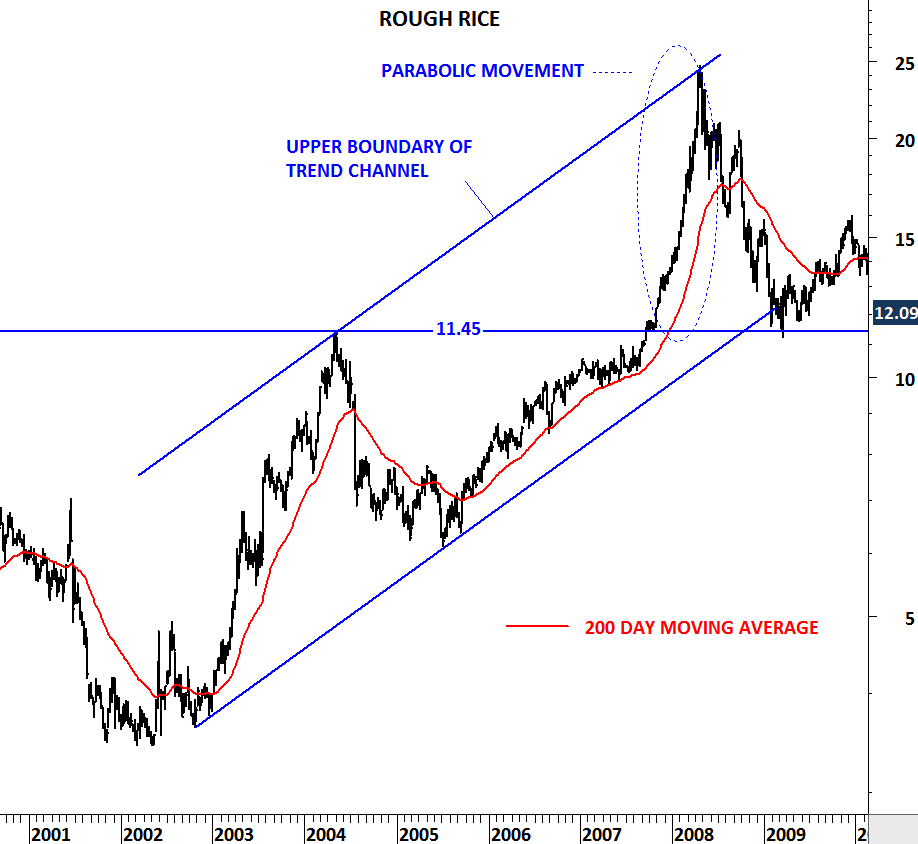
In 2008, Rough Rice price rallied from 11.45 to 25 levels. Rice made the headlines (news on Rough Rice). Hoarding and export bans were the result of the sharp price increase. Rough rice fell back to 11.45 levels in the following year.

ROUGH RICE

US DOLLAR/INDONESIAN RUPIAH

It’s been the year of the U.S. dollar. USD gained strength against most of the developed and emerging market currencies. Central Banks in emerging markets had to adjust interest rates to control currency depreciation. There is one emerging market cross rate that is worth paying attention to. Worst might not be over for the Indonesian rupiah as the USD/IDR cross rate challenges decade-long horizontal resistance. Breakouts from such long-term consolidations usually signal major shift in sentiment and also stress for the economic conditions. USD/IDR is testing critical levels and a breakout above 12,400 levels can result in a sharp depreciation of the currency.

USDIDR

Monthly scale price chart of the US Dollar / Indonesian Rupiah

Weekly scale chart shows the ascending triangle chart pattern – usually regarded as a bullish development in technical analysis. Both the boundaries of the ascending triangle and the decade-long flat consolidation range are overlapping at 12,400 levels – a technical condition that increases the validity of the resistance level.

USDIDR II

Weekly scale price chart of the U.S. Dollar / Indonesian Rupiah

COPPER

Once again copper is at that critical support. The more price tests an important support level the higher the probability of it breaking down. This is the case on copper price chart. 3 levels have been tested several times over the past 3 years. Commodities have been weak but copper held well above major support. Decisive close below 2.90-2.95 area will confirm breakdown from the descending triangle. Outlook for copper is negative.

COPPER

TURKEY BIST100

Turkish financial sector has been strong over the past few weeks. I don’t have the deep knowledge or the resources to understand the reasoning behind this. I would welcome any thought. But here, I’d like to share some chart evidence that supports further strength in the banking and financial sector stocks in the coming months. I’d also like to draw your attention to the latest bullish development on the Turkish government bond yields (which could have a positive impact on the financial sector).

TURKEY 2YR YIELDS

In September yields were targeting 11.8 levels. That direction would have been disastrous for the Turkish economy. In October we have seen a “V” reversal changing the whole picture to a more bullish one. 2 YR government bond yields can now target 5-6 area in the coming months.

XUIND XU100 II

Industrials vs. BIST 100 is a chart that I keep track of since 2003. When industrial sector outperforms it usually signals underperformance for the financial sector and this coincides with market corrections. XU IND/ XU 100 ratio is now reversing from a multi-year resistance suggesting financial sector outperformance and industrial underperformance.

Long-term chart patters are usually very powerful. When I see major chart patterns developing on long-term scale I pay close attention. Below are some of the financial sector stocks that has formed bullish chart patterns. Latest chart patterns or consolidations can be compared with 2010-2012 periods. I think they are similar.

HALKB

HALKBANK is forming a year-long inverse head and shoulder. Neckline stands at 16.80 levels

KCHOL

KOC HOLDING breaks out to all-time high levels. This is a bullish development.

SAHOL

SABANCI HOLDING formed a year-long inverse head and shoulder. Breakout above 10.60 will be very bullish.

VAKBN

VAKIFLAR BANK formed a year-long inverse head and shoulder with bullish implications. Breakout above 5.30 will be very positive for the stock.

YKBNK

Another inverse head and shoulder chart pattern can be seen on YAPI KREDI BANK.

RUSSIA MICEX INDEX

RUSSIA MICEX INDEX

One would think after sanctions and geopolitical tension Russian equities would experience sharp corrections or at least minor pullback. Chart suggests the opposite. Russian equities are gaining strength and MICEX index is now challenging year-long resistance at 1,530 levels. MICEX Index is cap-weighted composite index calculated based on prices of the 50 most liquid Russian stocks of the largest and dynamically developing Russian issuers presented on the Moscow Exchange. MICEX Index was launched on September 22, 1997 at base value 100. The MICEX Index is calculated in real-time and denominated by Moscow Exchange in Russian rubles. Breakout above 1,530 levels will clear the trend channel and horizontal resistance. Such price action will be positive in the medium/long-term.

NOVATEK

And NOVATEK – an energy company with $27 billion market cap is trying to breakout from a 3 year-long sideways consolidation to all-time high levels… Both charts are extremely constructive.

DAX, RUSSELL 2000, NIKKEI, STOXX 50

Global equity markets are experiencing significant weakness. I shared several updates over the past few weeks and updated the latest charts on twitter. It is important to share these updates with Tech Charts followers on different platforms. I’m adding latest tweets below.

NIKKEI, STOXX and FTSE

It is the time to take a more defensive stance in the global equity markets. MSCI All Countries World Index which includes the performance of developed and emerging markets, found resistance at 430 levels and reversed. MACD, a momentum indicator is generating a sell signal on the monthly scale chart. These are all bearish signals.

MSCI ALL COUNTRIES WORLD INDEX

STOXX 50 index found resistance at 14 year-long trend line at 3,100 levels. It needed a lot of momentum to clear such hurdle and it looks like the European equity benchmark failed to clear the strong multi-year resistance. Strong resistance remains at 3,100 levels.

STOXX 50 INDEX

Japan’s NIKKEI 225 index failed to clear 16,500 levels, another multi-year resistance. Index can pull back to its 2 year-long average at 14,000 levels. For now the market doesn’t have the strength to clear the strong long-term resistance.

NIKKEI 225 INDEX

UK’s FTSE 100 index reversed from strong multi-year resistance at 6,880 levels. The index failed to breakout to all-time high levels. Resistance remains at 6,880. Breakdown below the 2 year-long average at 6,400 levels can send the index towards 6,000 levels.

UK FTSE 100 INDEX

COPPER

Industrial metals continue to remain weak. Charts warn of a slowdown in global growth. Copper, usually regarded as Dr. Copper due to its leading indicator role for economic growth, is warning us of a possible breakdown and a correction.

Chart patterns are result of human interaction. Forces of greed and fear meet in the market place and form identifiable patterns on price charts. Descending triangle is one of the common bearish chart pattern. Horizontal support line shows the level where buyers step in. Downward sloping trend line shows the supply (resistance).

COPPER

Copper price formed a descending triangle over the past 3 years. Strong support remains at 3 levels. Breakdown below 3 levels can result in a sharp decline towards 2-2.5 range. Latest consolidation should resolve in one direction in the following weeks/month.

COPPER 2014

Copper had a similar descending triangle during 1989-1993 period. 4 year-year long chart pattern resolved on the downside with the breakdown of 0.95 support level in 1993. In less than six months prices have dropped to 0.72 levels.

COPPER 1990

DAX and RUSSELL 2000

Both DAX and Russell 2000 indices formed bearish chart patterns. These are developing chart patterns. In other words we still need to see confirmation. DAX is possibly forming a head and shoulder top. Neckline (support) is at 8,900 levels. Decisive breakdown below 8,900 will confirm the year-long top formation on Germany’s DAX index. Head and shoulder tops are bearish chart patterns.

DAX INDEX

Russell 2000 index might be forming a complex double top. 1,080 is a critical level for the index. Decisive breakdown below 1,080 levels will confirm the year-long top formation. These two charts should be on our watch list in the following weeks/month.

RUSSELL 2000 INDEX

LUMBER

Lumber prices prepare for a strong breakout from a 2 year-long consolidation. Since the beginning of 2013, prices have been consolidating in a contracting range with the boundaries now standing at 360 and 300 levels. Latest rally towards the upper boundary suggests prices are likely to challenge the strong resistance in the following days/week. A decisive breakout above 360 levels will be positive and will target 400 levels in the short/medium-term.

LUMBER II