LONG-TERM CHARTS & LAUNCHING PATTERNS

Stock prices are either in a follow through trending phase or in a consolidation phase. During a strong trending period, a stock will proceed from one price level to another with very little interruption. During a consolidation period a stock will move in both directions without producing any meaningful or sustained price change.

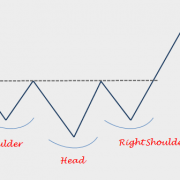
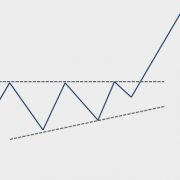
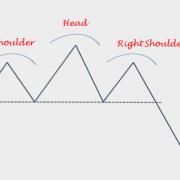
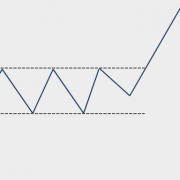
During periods of consolidation prices tend to form a recognizable chart pattern which helps us to determine the direction and magnitude of the next substantial trend with some degree of accuracy.

Because price action and chart patterns are a result of human interaction, it is possible to find those repeating chart patterns in different markets, in different time frames such as on daily, weekly and monthly scale and in different time periods.

Read more

GLOBAL EQUITY MARKETS – June 3, 2017

This week’s Global Equity Markets report covers several ETFs and global equity indices and single stocks from Developed and Emerging countries. You will find that some of the themes are longer-term and can offer great opportunity once these chart patterns are resolved on the upside. The info-graphic below explains what each label on the charts and section headers stand for. I hope this will make it easier to navigate through the charts.

Read more

Ascending Triangle – Bullish Continuation

You don’t have access to view this content

Head and Shoulders Top – Bearish Reversal

You don’t have access to view this content

Review of the Best Classical Chart Pattern Breakouts

Every week, as I go through 1000’s of charts. I look for select, common characteristics on developing chart patterns. And the chart pattern should be mature on a weekly scale. For me, this means chart patterns in duration between 3 to 24 months. It should have a well-defined and preferably a horizontal chart pattern boundary. I look for chart patterns classified as H&S top/bottom, rectangles, cup & handle continuations, double top/bottoms and flags. I only feature symmetrical triangles that have well-defined boundaries. The boundary of the chart pattern should be tested several times before the breakout takes place. Several tests of a chart pattern boundary is an indication that market participants actually recognized the pattern boundary as an important technical level. A breach of this level would signal a shift in the market dynamics between the bulls and the bears.

GLOBAL EQUITY MARKETS – May 27, 2017

Dear Tech Charts members,

Thank you for joining Tech Charts as Founding Member. I hope to identify many great chart set-ups, trading & investment themes and add value to your decision making process in the years ahead. This week’s Global Equity Markets report covers several ETFs from different regions, single stocks from Developed and Emerging countries and equity indices. You will find that some of the themes are longer-term and can offer great opportunity once these chart patterns are resolved on the upside. In this report I also added a section that explains what each label on the charts and section headers stand for. I hope this will make it easier to navigate through the charts.


Read more

Tech Charts Service – Webinar Recording

Please watch this interview between Aksel Kibar and Peter Brandt discussing the Tech Charts Service.  Your opportunity to join as a Founding Member (at discounted for life) expires on June 1st.

Aksel goes into detail about what you could expect as a Founding Member (Sign up links below video), service includes:

  • Yearly membership  –   Substantially discounted for as long as you keep renewing
  • Global Equities Report  – Delivered weekly
  • Classical charting principles  – Learn patterns and setups
  • Actionable information  – Worldwide indices and stocks of interest
  • Risk management advice  – The important trading points of each chart.
  • Information on breakout opportunities  – Identify the ones you want to take action on
  • Video tutorials  – How patterns form and why they succeed or fail
  • Watch list alerts  – As they become available so you can act quickly
  • Breakout alerts  – Usually once a week
  • Multi-part webinar course  – You learn the 8 most common charting principles
  • Webinars  – Actionable and timely advice on breaking out chart patterns

Webinar Recording


Hurry before it ends.  Obtain Founding Member status and receive a discounted price for LIFE!

Sign up here:  https://blog.techcharts.net


Rectangle – Bullish Continuation

You don’t have access to view this content