
LONG-TERM CHARTS & LAUNCHING PATTERNS
Stock prices are either in a follow through trending phase or in a consolidation phase. During a strong trending period, a stock will proceed from one price level to another with very little interruption. During a consolidation period a stock will move in both directions without producing any meaningful or sustained price change.
During periods of consolidation prices tend to form a recognizable chart pattern which helps us to determine the direction and magnitude of the next substantial trend with some degree of accuracy.
Because price action and chart patterns are a result of human interaction, it is possible to find those repeating chart patterns in different markets, in different time frames such as on daily, weekly and monthly scale and in different time periods.
Chart patterns form over varying duration. On a weekly scale chart, a 3 month-long consolidation pattern can exist within say a year-long chart pattern. These shorter and longer duration chart patterns can have the same boundary lines and a breakout from the short-term chart pattern can also complete the long-term chart pattern.
In such cases the short-term chart pattern is called a launching pattern. Identifying a launching pattern can be important. Breakout from such consolidation periods will not only trigger a chart pattern breakout signal in the short/medium-term but also result in a long-term shift in the direction of the trend.
Learn More about Launching Patterns:
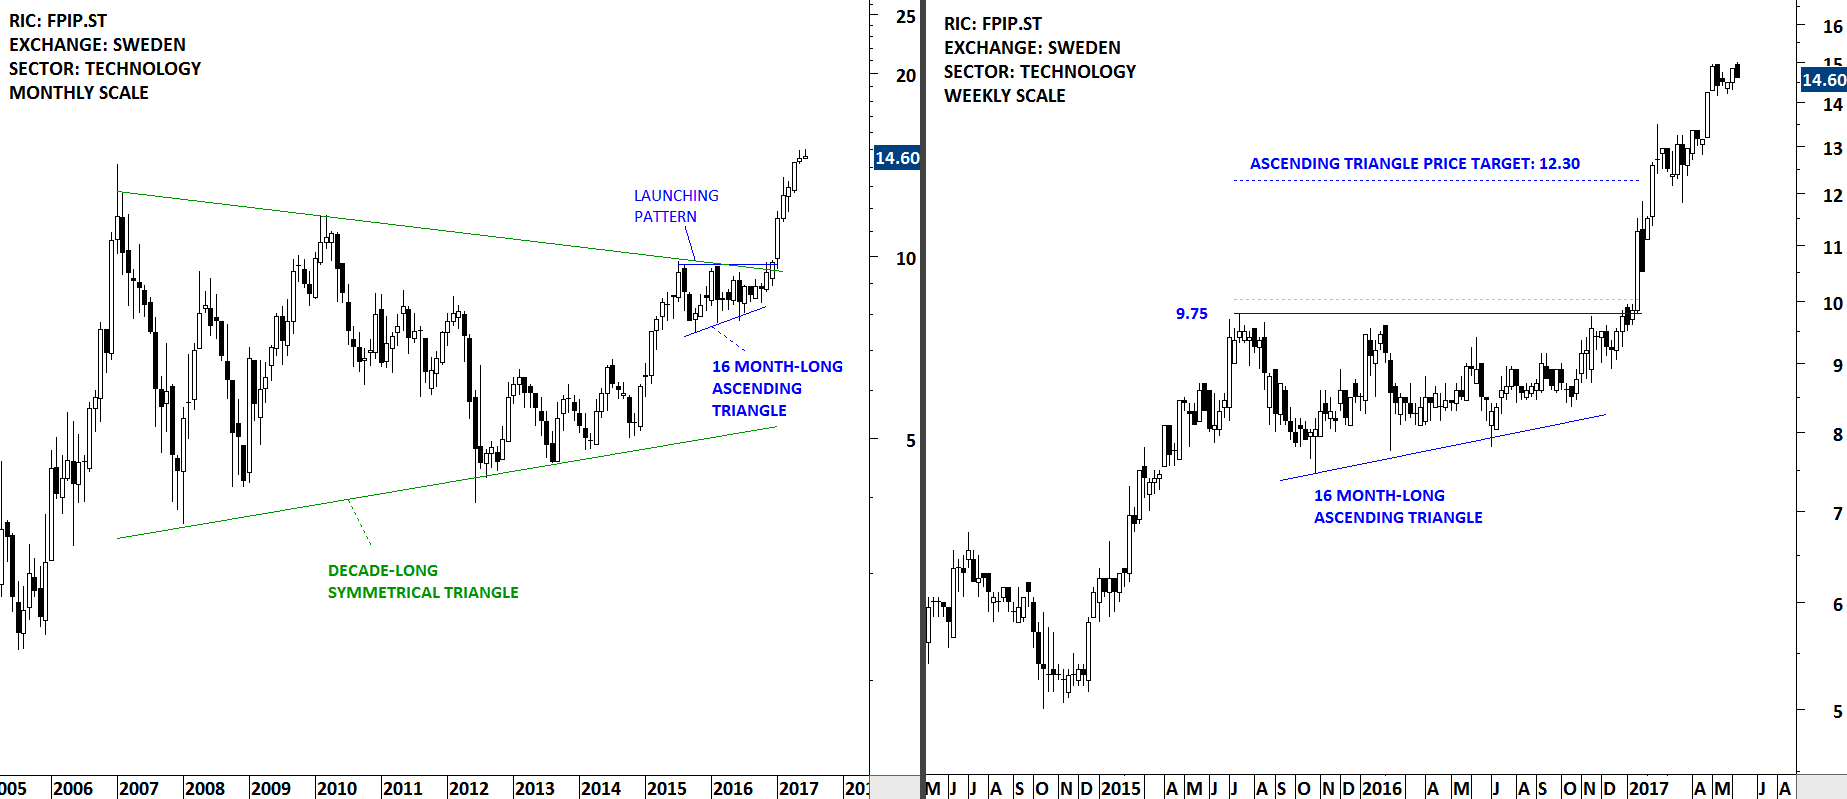
In late 2016, a Swedish company FORMPIPE formed a 16 month-long ascending triangle as part of a decade long symmetrical triangle. Tech Charts identified this chart pattern development as a launching pattern. Breakout completed both chart patterns and resulted in a strong trend period. Ascending triangle is a bullish continuation chart pattern.
FORMPIPE (FPIP.ST)
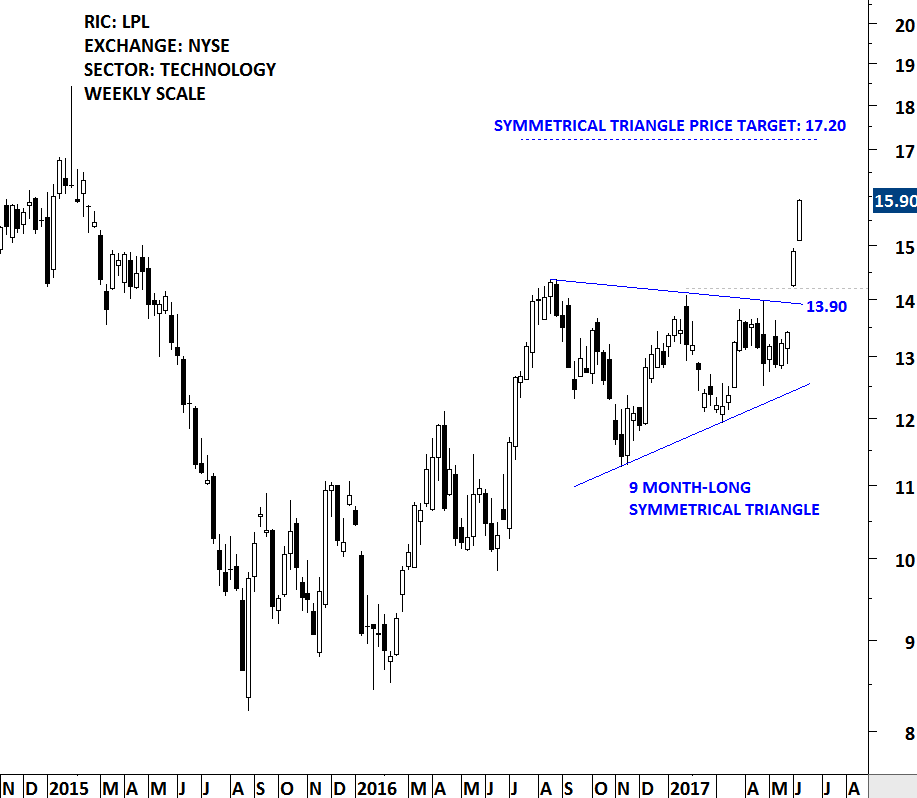
Over the past few weeks similar price action was identified on a South Korean company LG DISPLAY and the opportunity was featured in the Global Equity Markets reports. The 9 month-long ascending triangle is acting as a launching pattern. Breakout from the 9 month-long bullish continuation chart pattern is taking place at the same level from the decade-long symmetrical triangle.
LG DISPLAY (034220.KS)

LG DISPLAY is listed on the NYSE via depository receipts. Price chart of the New York Stock Exchange listing also completed a well-defined chart symmetrical triangle chart pattern. Members were alerted to this opportunity as well.
LG DISPLAY (LPL)
Tech Charts Membership

By becoming a Premium Member, you’ll be able to improve your knowledge of the principles of classical charting.
With this knowledge, you can merge them with your investing system. In fact, some investors use my analyses to modify their existing style to invest more efficiently and successfully.

As a Premium Member of
Aksel Kibar’s Tech Charts,
You will receive:
-
Global Equities ReportDelivered weekly
-
Classical charting principlesLearn patterns and setups
-
Actionable informationWorldwide indices and stocks of interest
-
Risk management adviceThe important trading points of each chart.
-
Information on breakout opportunitiesIdentify the ones you want to take action on
-
Video tutorialsHow patterns form and why they succeed or fail
-
Watch list alertsAs they become available so you can act quickly
-
Breakout alertsUsually once a week
-
Access to everything (now and as it becomes available)o Reports
o Videos and video series -
Multi-part webinar courseYou learn the 8 most common charting principles
-
WebinarsActionable and timely advice on breaking out chart patterns
For your convenience your membership auto renews each year.


