Posts

Ascending Triangle Chart Patterns – March 2018 Tech Charts Webinar

Ascending Triangle Chart Patterns - March 2018 Tech Charts Webinar 
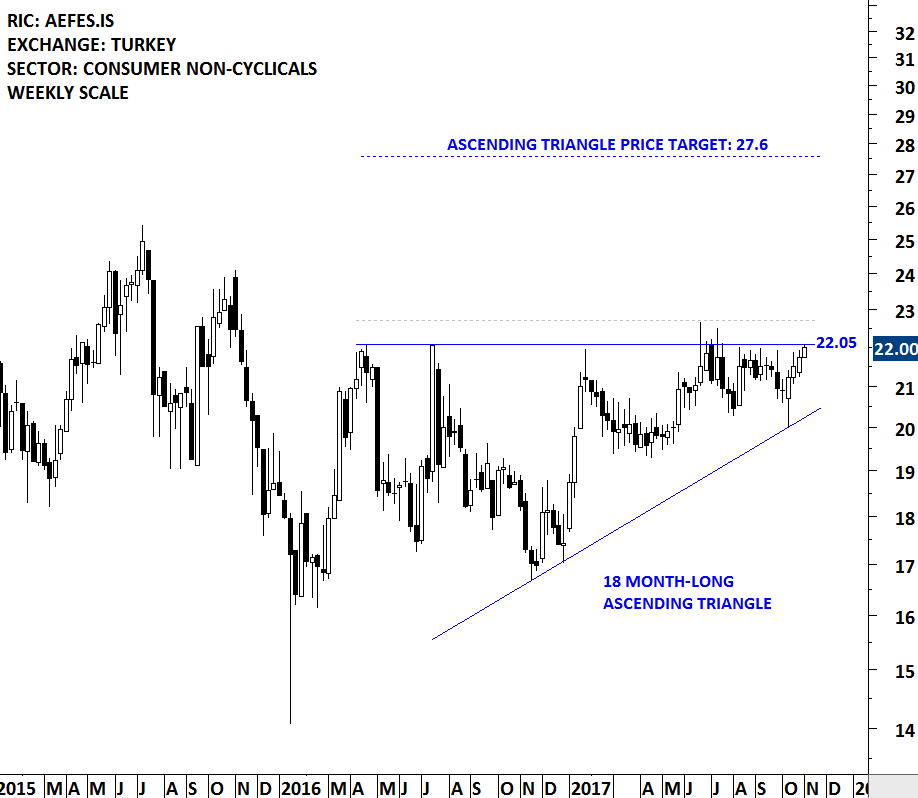
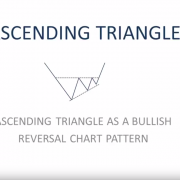
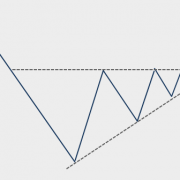
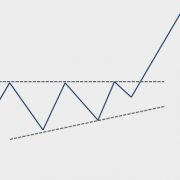
  • Ascending triangle is a reliable bullish chart pattern that can act as a bottom reversal and continuation
  • Breakouts from chart patterns with horizontal boundaries are more reliable when compared with breakouts from diagonal boundaries
  • Important technical points when identifying ascending triangle chart patterns
  • Importance of several tests of chart pattern boundary before a breakout takes place
  • The broader context of price action and where the ascending triangle chart pattern forms
  • Ascending triangle as a launching pattern
  • Ascending triangle forming as a bottom reversal will take longer to develop
  • Review of ascending triangle chart pattern breakouts between May 2017 and February 2017
  • Defining chart pattern negation level and a logical point to label chart pattern negation on ascending triangle
  • Recent chart pattern breakouts
  • Developing ascending triangle chart patterns; a review of watchlist candidates
  • Q&A
Live questions from Members  
  1. Which broker do you recommend, where I can trade these stocks? I’m having a hard time finding one. 48:05
  2. If I’m new to classical charting, what should I do to learn how to identify each pattern? 49:45
  3. Any comment you care to make on the state of global markets? Europe and Japan look on edge… 51:44
  4. Do you actually search through hundreds of charts each week or do you use a software that alerts you to a breakout taking place across various markets? 53:14
  5. Science vs Art question - on the SBLK chart can you discuss your reasons for drawing the horizontal line where you did? 58:13
  6. Do you sell all your positions at profit target, if not how do you scale out? 1:00:33
  7. Do you look at currency and commodity patterns?1:01:23
  8. Do you look also for short sale candidates? 1:02:30
  9. Is there any point to consider when applying classical chart patterns on forex charts instead of stock? 1:04:50
  10. Do you have an estimate of timing - when the target should be met breaking out of these ascending triangle? 1:05:45
Recorded live 3.8.2018    Read More

ANADOLU EFES & ASCENDING TRIANGLE

Every week Tech Charts Global Equity Markets report features some of the well-defined, mature classical chart patterns under a lengthy watchlist and the chart pattern breakout signals that took place during that week. Global Equity Markets report covers single stocks from developed and emerging markets, ETF’s and global equity indices. The report starts with a review section that highlights the important chart developments on global equity benchmarks. This blog post features one of several great chart analysis that were highlighted in the watchlist section from the latest Global Equity Markets report.

 (AEFES.IS)

Anadolu Efes Biracilik ve Malt Sanayii AS is a Turkey-based company, which is engaged in the production, bottling, selling and distribution of beer under a number of trademarks and also in the production, bottling, selling and distribution of sparkling and still beverages with The Coca-Cola Company trademark. The stock is listed on the Istanbul Stock Exchange. Price chart formed an 18 month-long ascending triangle with the strong horizontal boundary acting as resistance at 22.05 levels. The horizontal boundary was tested several times over the course of the chart pattern. The ascending triangle can act as a reversal chart pattern. A daily close above 22.70 levels will confirm the breakout from the bullish reversal chart pattern with the possible price target of 27.6 levels.

Read More
Right Angle Ascending Traingle - Tech Charts

Ascending Triangle – Bullish Reversal

Right angle triangles, with the hypotenuse slanting upwards from the origin of the pattern, are ascending triangles and they are bullish.

The below educational video describes how to identify a bullish ascending triangle, along with some of the characteristics of this pattern that could help you identify and take advantage of such patterns within your own personal trading.

LONG-TERM CHARTS & LAUNCHING PATTERNS

Stock prices are either in a follow through trending phase or in a consolidation phase. During a strong trending period, a stock will proceed from one price level to another with very little interruption. During a consolidation period a stock will move in both directions without producing any meaningful or sustained price change.

During periods of consolidation prices tend to form a recognizable chart pattern which helps us to determine the direction and magnitude of the next substantial trend with some degree of accuracy.

Because price action and chart patterns are a result of human interaction, it is possible to find those repeating chart patterns in different markets, in different time frames such as on daily, weekly and monthly scale and in different time periods.

Read More