GLOBAL EQUITY MARKETS – April 22, 2017

It was a mixed week for Global equity market performance due to each countries own political and geopolitical developments. However, the benchmark for Global equities, the MSCI ALL COUNTRY WORLD INDEX still shows a clear uptrend. MSCI ALL COUNTRIES WORLD INDEX captures large and mid cap representation across 23 Developed Markets and 23 Emerging Markets countries. With 2,481 constituents, the index covers approximately 85% of the global investable equity opportunity set. iShares has an MSCI ACWI ETF that seeks to track the MSCI ALL COUNTRIES WORLD INDEX. The ETF is listed on the Nasdaq Stock Exchange.

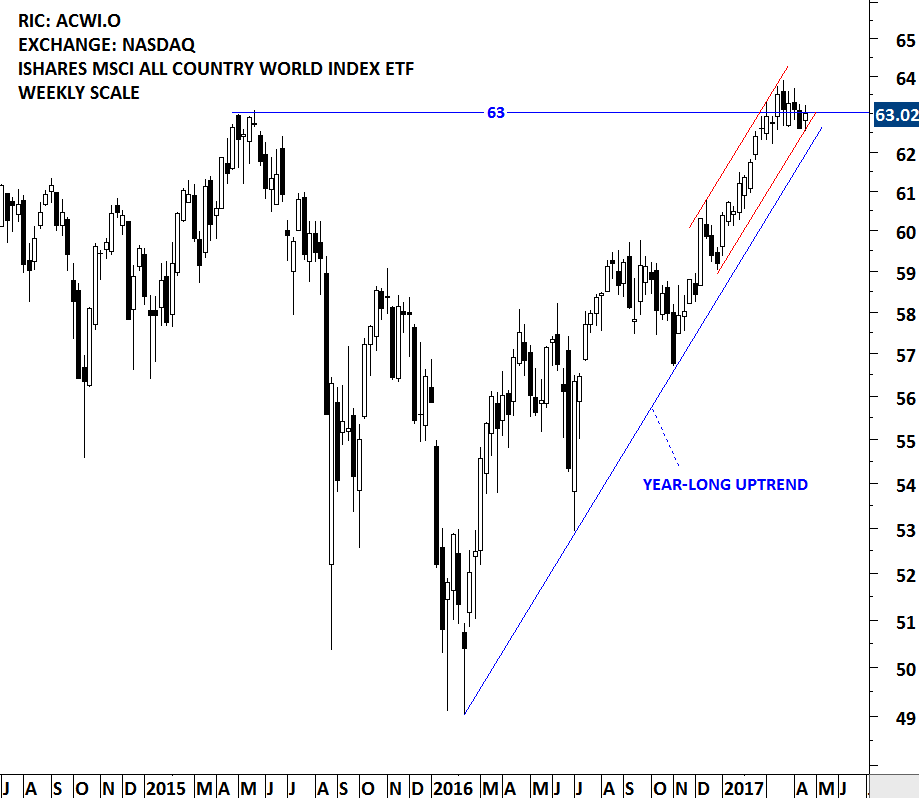
Since the beginning of 2016, MSCI ACWI ETF (ACWI.O) is in a clear uptrend. Over the past two months the price has been challenging the resistance at 63 levels. The continuation of the uptrend will depend on the strength around this resistance level.

iSHARES MSCI ACWI ETF (ACWI.O)

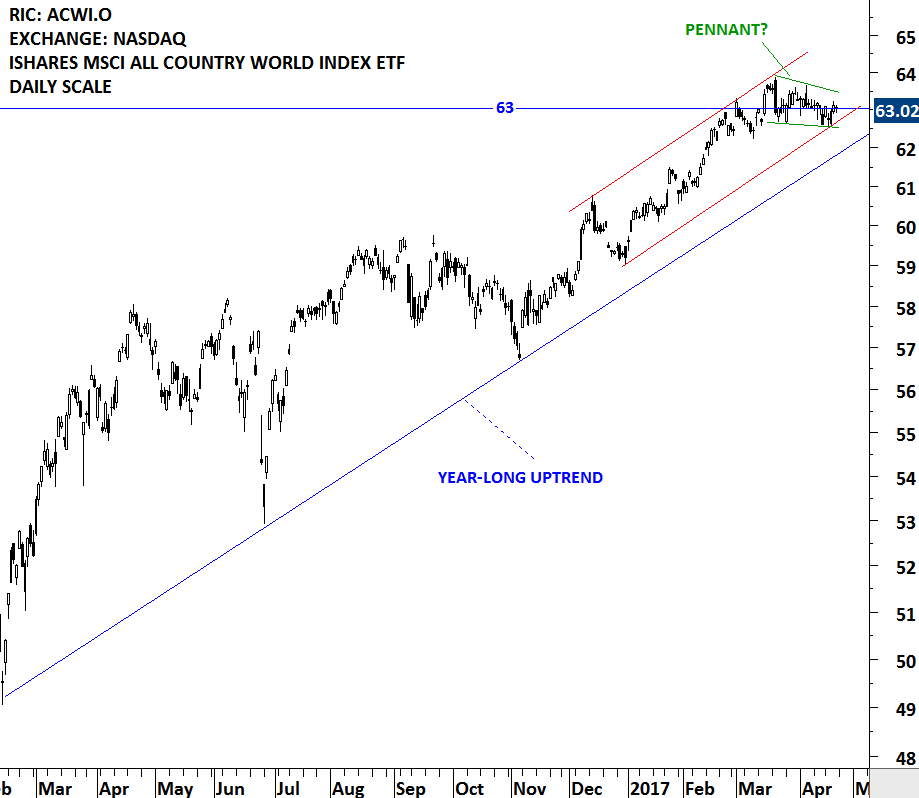
Last one month’s price action can be identified as a possible pennant formation. Pennants are short-term continuation patterns that mark a small consolidation before the previous move resumes. Pennants, which are similar to flags in terms of structure, have converging trendlines during their consolidation period and they last from one to three weeks. Breakout above 63 levels can renew upside momentum both on daily and weekly scale. Strong support area remains between 62 and 62.5.

This week there are 3 new chart pattern breakout signals.

Read more

U.S. BANKING STOCKS

Up trends are still intact on the financial stocks in the U.S. A quick look at U.S. banking stocks can help us put things into perspective on the medium/long-term charts. This update reviews 6 different U.S. commercial banks. As you go through the charts of these commerical banking stocks you will find similar technical outlook as outlined below.

  1. In November 2016, following the U.S. election, all of these names had strong breakouts from lengthy consolidation periods.
  2. Most of the names have reached their chart pattern price targets.
  3. Since the beginning of 2016, all of the charts analyzed have formed consistent up trends as identified by parallel trend channels.
  4. Over the past 3 months, all of the names have pulled back to their 200-day averages.

Read more

GLOBAL EQUITY MARKETS – April 14, 2017

A relatively short but eventful trading week is behind us. Volatility increased due to geopolitical tensions. Equity indices came under pressure with bonds moving higher. There were 4 new chart pattern breakout signals during the week. Irrespective of general market direction, I try to feature those breakouts and breakdowns from well-defined trading ranges as they develop.

#TECHCHARTSALERT


CBOE VOLATILITY INDEX (VIX)

Over the past 5 months, the VIX consolidated between 10 and 15 levels. Price tested the horizontal resistance at 14.75 for 3 times over the course of the 5 month-long consolidation. Since the beginning of April, volatility index has been inching higher towards the strong resistance. The daily close above 15.15 levels completed the 5 month-long consolidation. Our focus is now on two important levels. First one is 14.75, that will act as support during any possible pullback. Failure to hold above 14.75 will put the interpretation of higher levels into question. Second one is the chart pattern price target at 19 levels. Price target is calculated by taking the width of the 5 month-long consolidation and adding it to the breakout level.

Read more

CBOE VOLATILITY INDEX (VIX)

Strong technical support & resistance levels are formed after consecutive tests of the same price level. Support/resistance areas show the battle between the buyers and the sellers. The strong resistance for the CBOE VOLATILITY INDEX (VIX) stands at 14.75 levels. Over the past 5 months, the VIX consolidated between 10 and 15 levels. Price tested the horizontal resistance at 14.75 for 3 times over the course of the 5 month-long consolidation. Since the beginning of April, volatility index has been inching higher towards the strong resistance. A daily close above 15.15 levels can complete the 5 month-long consolidation and result in a spike in volatility. A spike in volatility can put downward pressure on global equity indices. This chart should be on your radar in the coming weeks.

Read more

GLOBAL EQUITY MARKETS – April 8, 2017

It has been a volatile week in the Global equity markets. There were 2 new breakout alerts. Both stocks cleared strong multi-month horizontal resistances.

#TECHCHARTSALERT


TINGYI CAYMAN ISLANDS HOLDING CORP (0322.HK)

Tingyi (Cayman Islands) Holdings Corp. is a Hong Kong-based investment holding company principally engaged in the production and sales of instant noodles, beverages and instant food products. The stock is listed on the Hong Kong Stock Exchange. Price chart formed a 15 month-long H&S bottom with the right shoulder in the form of a 6 month-long rectangle. The neckline of the H&S bottom standing as a resistance at 9.85 has been tested for 4 times over the past year. The daily close above 10.15 confirmed the breakout from the multi-month base formation. 9.85 levels will now become support. Possible chart pattern price target stands at 13.15 levels.

Read more

JAPAN NIKKEI 225 INDEX

Rectangles are usually considered to be a continuation chart pattern. They form as a trading range during a pause in the trend. The pattern is identifiable by two comparable highs and two comparable lows. Rectangles are sometimes referred to as consolidation ranges or trading areas. The rectangle chart pattern is not complete until a breakout is occurred.

To qualify as a continuation chart pattern, a prior trend should exist. Rectangles can extend for a few weeks or many months. If the pattern is less than 3 weeks, it is usually considered a flag, also a continuation chart pattern. Ideally, rectangles will develop over a 3-month period. Generally, the longer the pattern, the more significant the breakout. The direction of the next significant move can only be determined after the breakout has occurred. The estimated move is found by measuring the height of the rectangle and applying it to the breakout level.

JAPAN NIKKEI 225 INDEX FUTURES 1st month continuation

Japan’s NIKKEI 225 Index is possibly forming a rectangle chart pattern with the boundaries between 18,800 and 19,690. The index is now testing the lower boundary of its 4 month-long sideways consolidation. Due to the tight consolidation range, volatility on both daily and weekly scale reached an extreme low level. These type of low volatility periods are usually followed by strong price action. It is important to note that there are times when a rectangle can act as a reversal chart pattern. A breakdown below the lower boundary at 18,800 will suggest lower prices in the coming weeks. However, failure to breakdown the support at 18,800 and a possible rebound from the current levels will increase the likelihood of a rectangle as a continuation chart pattern, targeting higher levels.

Read more

GLOBAL EQUITY MARKETS – April 1, 2017

After several years of downtrend and a major bear market, Greek equities can offer great opportunities in the following weeks/months. This week’s update features two benchmark equity indices from Greece. Athens General Composite index with a long-term view and FTSE Athex Market index with the latest bullish chart development. In the beginning of 2016, Athens General Index rebounded from the lows of 2012. Over the past year the index remained sideways in a choppy trading range. Last one year’s range bound price action is possibly a bullish ascending triangle with the horizontal boundary standing at 445 levels for the FTSE Athex Market Index and at 665 levels for the Athens General Composite index. The upward sloping lower boundary of the ascending triangle gives the chart pattern its bullish bias. Higher lows is indicative of increasing demand. A daily close above 460 levels on the FTSE Athex Market Index will confirm the breakout from the year-long ascending triangle with a possible price target of 580 levels.

ATHENS GENERAL INDEX (.ATG)


Read more

GLOBAL EQUITY MARKETS – March 25, 2017

Global equity markets continue to offer great opportunities and text book chart pattern developments. In this update I bring to your attention well-defined chart patterns from Asia, Europe, North America and Emerging Markets that are candidates for possible breakouts and I also report fresh breakout alerts. Before we move on to equity markets, I want to draw your attention to a possibility developing in the interest rates and bonds market. During the weekly review of financial markets, I spotted the similar chart development on almost all kinds of bond market ETFs.

ISHARES BARCLAYS 20+YR TREASURY BOND ETF (TLT.O)

ISHARES BARCLAYS 20+YR TREASURY BOND ETF is an exchange traded fund listed on the Nasdaq Stock Exchange. The Fund seeks investment results that correspond generally to the price and yield performance of the long-term sector of the U.S. Treasury market as defined by the Barclays Capital 20+ Year Treasury Index. Price chart of this ETF is possibly forming a 4 month-long double bottom. This chart pattern is still at its early stages. The short-term consolidation remains between 117 and 123 levels. The low for the year 2015 stands at 115 as an other important medium/long-term support level. The latest chart development suggests that in the short/medium-term bonds might be finding support. Price should either break 117 levels on the downside or 123 levels on the upside for the chart pattern to complete.

Read more

GLOBAL EQUITY MARKETS – March 12, 2017

This week there has been 7 additions to the #TECHCHARTSWATCHLIST. Most of the chart patterns are bullish as major global equity indices continue to remain in a uptrend.

#TECHCHARTSWATCHLIST


SSY GROUP LTD (2005.HK)

SSY Group Limited is an investment holding company principally engaged in the research, development, manufacture and sale of pharmaceutical products. The stock is listed on the Hong Kong Stock Exchange. Price chart of SSY GROUP formed a 10 month-long rectangle with the strong horizontal resistance standing at 2.78 levels. Rectangle is a continuation chart pattern. A daily close above 2.86 will confirm the breakout from the bullish chart pattern. Possible price target for the rectangle stands at 3.2 levels.

SSY GROUP – WEEKLY SCALE

Read more