TURKCELL (TKC) – TURKEY

Every week Tech Charts Global Equity Markets report features some of the well-defined, mature classical chart patterns under a lengthy watchlist and the chart pattern breakout signals that took place during that week. Global Equity Markets report covers single stocks from developed and emerging markets, ETF’s and global equity indices. The main focus of the weekly report is to bring member’s attention some of the best examples of classical charting. Chart patterns that are likely to resolve in a directional move. This blog post highlights one of several great chart setups from the latest Global Equity Markets report. Below you will also find a sample educational video on rectangle chart pattern as well as past examples of Tech Charts Breakout Alerts on Rectangles.

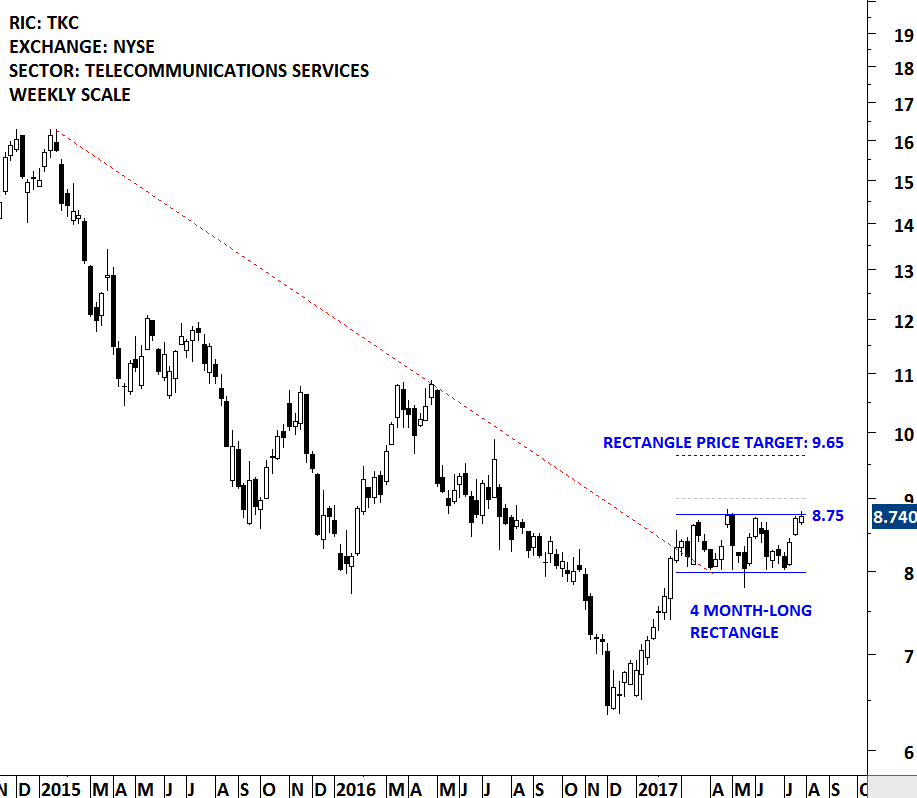
TURKCELL ILETISIM HIZMETLERI (TKC)

Turkcell Iletisim Hizmetleri AS is engaged in establishing and operating a Global System for Mobile Communications (GSM) network in Turkey and regional states. The stock is listed on the New York Stock Exchange via depository receipts. Price chart formed a 4 month-long rectangle with the horizontal boundary standing as resistance at 8.75 levels. A daily close above 9 levels will confirm the breakout from the bullish continuation chart pattern with a possible price target of 9.65 levels. Rectangle can act as a bullish continuation chart pattern.

Read more

GLOBAL EQUITY MARKETS – July 22, 2017

REVIEW


U.S. Biotech stocks resume uptrend after their strong breakout in the last week of June. June 17, 2017 and June 24, 2017 Global Equity Markets reports drew attention to the strength in the Biotech ETFs and alerted members on the multi-month bullish chart pattern completions. Both SPDR S&P BIOTECH ETF and ISHARES NASDAQ BIOTECH ETF had strong breakouts. After few weeks of pull back to the previously broken chart pattern boundary, NASDAQ BIOTECH INDEX resumed its uptrend. Read more

iShares MSCI UAE Capped ETF

The Fund seeks to track the investment results of the MSCI All UAE Capped Index, which is designed to measure the equity market performance in the United Arab Emirates. The Fund generally invests at least 80% of its assets in securities of the underlying index or in depository receipts representing securities of the underlying index. The ETF is listed on the Nasdaq Stock Exchange. Price chart possibly formed a 15 month-long H&S continuation or a rectangle with the strong horizontal boundary standing at 17.75 levels. Last 6 month’s price action can also be identified as a rectangle; another short-term consolidation, usually acting as a preparation for a breakout. A daily close above 18.10 levels will confirm the breakout from the multi-month trading range with the chart pattern price target of 20 levels. Top 10 holdings of the iShares MSCI UAE Capped ETF is compiled in a table below. Also you can find below some examples of H&S continuation chart patterns that Tech Charts Global Equity Markets reports featured in the past issues.

Read more

GLOBAL EQUITY MARKETS – July 15, 2017

REVIEW


Global equities had a strong performance led by Emerging Market equities and mainly Chinese Large-caps. MSCI Emerging Markets Index breached its decade-long trend line resistance at 1,020 levels. Tech Charts Global Equity Markets reports drew attention to the developing strength in Emerging Asia equities. Following the strong performance of S.Korea, Taiwan, India and Philippines, Chinese equities are also joining the list. An interim update was sent out during the week discussing the strong breakout on the Ishares China Large Cap ETF (FXI). Below charts feature the MSCI Emerging Markets Index (Price index in USD) and the New York Stock Exchange listed iShares MSCI Emerging Markets ETF (EEM).

Read more

INTERIM UPDATE – July 13, 2017

ISHARES CHINA LARGE CAP ETF (FXI)

A major chart pattern development is taking place on the Chinese equity ETF that is listed on the New York Stock Exchange. Ishares China Large Cap ETF is possibly completing a major 20 month-long base formation. Multi-month H&S bottom chart pattern has a neckline at 39.65 levels. Breakout attempt in the first quarter of 2017, was followed by a short-term set-back that found support at the neckline. However, during this week we can see that the China Large Cap ETF gained momentum once again. Read more

EUROSTOXX 50 INDEX & EMERGING MARKETS

There is enough technical evidence that emerging markets found strong resistance around the current levels. The MSCI EM USD price index tested its decade-long trend line and also the upper boundary of its year-long trend channel. However, it is still early to call for a possible reversal from the strong resistance area. MSCI EM index is possibly forming a decade-long symmetrical triangle.

Read more

GLOBAL EQUITY MARKETS – July 8, 2017

REVIEW


It has been more than six months that the U.S. small caps are trading in a tight range. One of the well-defined chart patterns the weekly global equity markets report frequently discussed was the ISHARES CORE S&P Small-Cap ETF. IJR has a well-defined trading range between 66.9 and 70.8 levels. The ETFs price is holding above the 18 month-long upward trend line. A directional move should follow soon. The margin between the multi-month trend line and the upper boundary of the 6 month-long rectangle has narrowed. A daily close above 71.80 will confirm the breakout from the 5 month-long rectangle and suggest higher prices. A breach below the 18 month-long trend line can put pressure on the small caps and push prices towards the lower boundary of the rectangle at 66.9 levels.

Read more

ISHARES INTERNATIONAL PREFERRED STOCK ETF

ISHARES INTL PREFERRED STOCK ETF (IPFF.K) formed an 18 month-long ascending triangle. IPFF.K has a well-defined horizontal resistance that was tested several times over the course of the chart pattern. Strong horizontal boundary stands at 17.45 levels. Last 5 month’s price action can be identified as a rectangle. The 5 month-long rectangle is acting as a launching pattern (learn more about launching patterns – Video Tutorial). The daily close above 17.80 levels confirmed the breakout from the multi-month ascending triangle with the possible price target of 21.40 levels.

Read more

GLOBAL EQUITY MARKETS – July 1, 2017

REVIEW


Europe’s equity benchmarks tested critical long-term resistances. After reversing from the multi-year trend line, Euro Stoxx 50 index pulled back to the lower boundary of its year-long trend channel. If the 2 month-long correction has run its course (still no sign of reversal), Europe’s equity benchmark can possibly rebound from the lower boundary of its trend channel. During May 2017 the index tested 3,670 levels and since then retreated towards the lower boundary of its year-long trend channel. Failure to hold at the lower boundary of the trend channel can extend the duration of the corrective period.

Read more

GLOBAL EQUITY MARKETS – June 24, 2017

REVIEW


MSCI decision was the main driver for the strong performance of Saudi Arabia stock index during the week. (Read more on this) Strong price action cleared the 5 month-long pennant and resumed the uptrend towards the double bottom price target at 8,250 levels. Saudi Arabia’s positive chart pattern developments were discussed in the Interim Update June 19, 2017 and June 3, 2017 report. Double bottom is a bullish reversal chart pattern and pennant is a bullish continuation chart pattern.

Read more