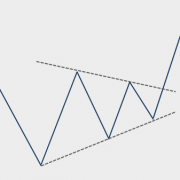
Symmetrical Triangle – Bullish Reversal
You don’t have access to view this content
You don’t have access to view this content

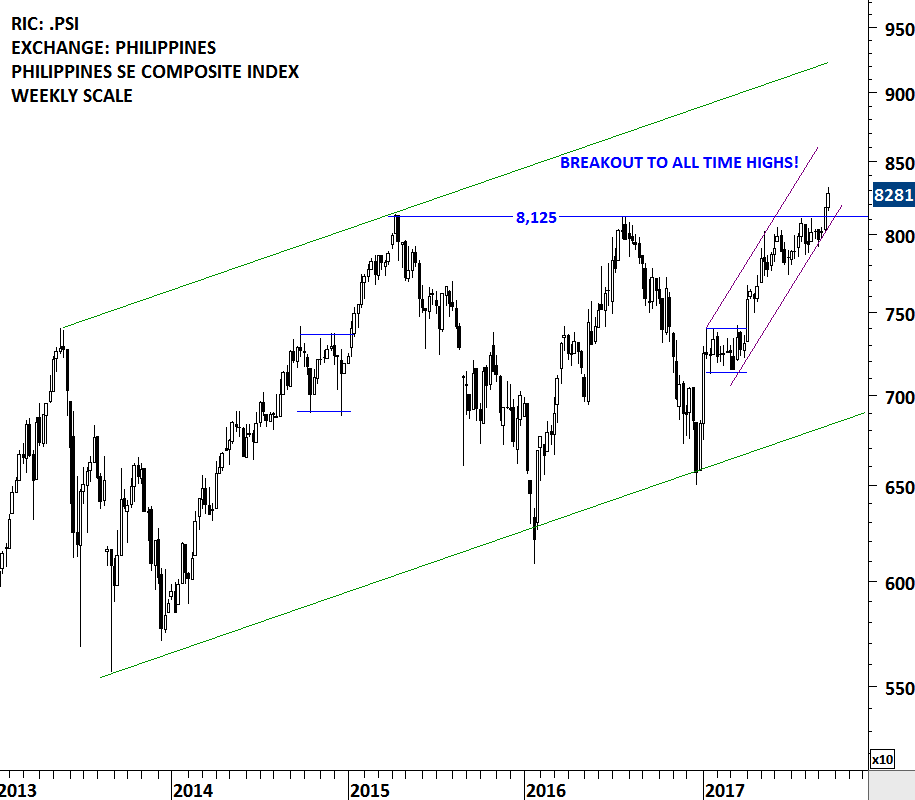
Another Emerging Asia equity index broke out to new all-time highs. Philippines SE Composite index breached the 8,125 level after moving in a 2 year-long, wide trading range between 6,500 and 8,125 levels. The equity benchmark has been in a steady uptrend for the past year. Last two week’s price action cleared the strong horizontal resistance and pushed the index to uncharted territory. Once a strong resistance, 8,125 level now acts as support. As long as the index holds above that level we will expect positive momentum to continue in the Philippine Stock Exchange. An efficient way to take advantage of the recent bullish technical development in the Emerging Asian country is through iShares MSCI Philippines ETF (EPHE.K) that is listed on the New York Stock Exchange. The chart below reviews the iShares MSCI Philippines ETF.

Below two paragraphs are taken from Peter L. Brandt’s Diary of a Professional Commodity Trader – Lessons from 21 weeks of real trading.
“A premature breakout is different from an out of line movement in the sense that a premature breakout can close outside of a predrawn boundary line and even spend several days in breakout mode. Prices then return back to the geometric pattern. However, the initial breakout was only a harbinger of things to come, and within a few weeks a genuine breakout occurs. I call these subsequent breakouts secondary breakouts or pattern recompletions.” – Ch 3, page 38, Identifying the trades and the trading vocabulary
“Unlike the premature breakout, which is followed by a genuine breakout in the same direction, the false breakout results in prices either developing a much larger pattern or strongly moving in the opposite direction. Some traders refer to false breakouts to the downside as a bear trap and false upside breakouts as a bull trap. This means that traders who normally position themselves in the direction of the initial price thrust get stuck on the wrong side of the market.” – Ch 3, page 40, Identifying the trades and the trading vocabulary

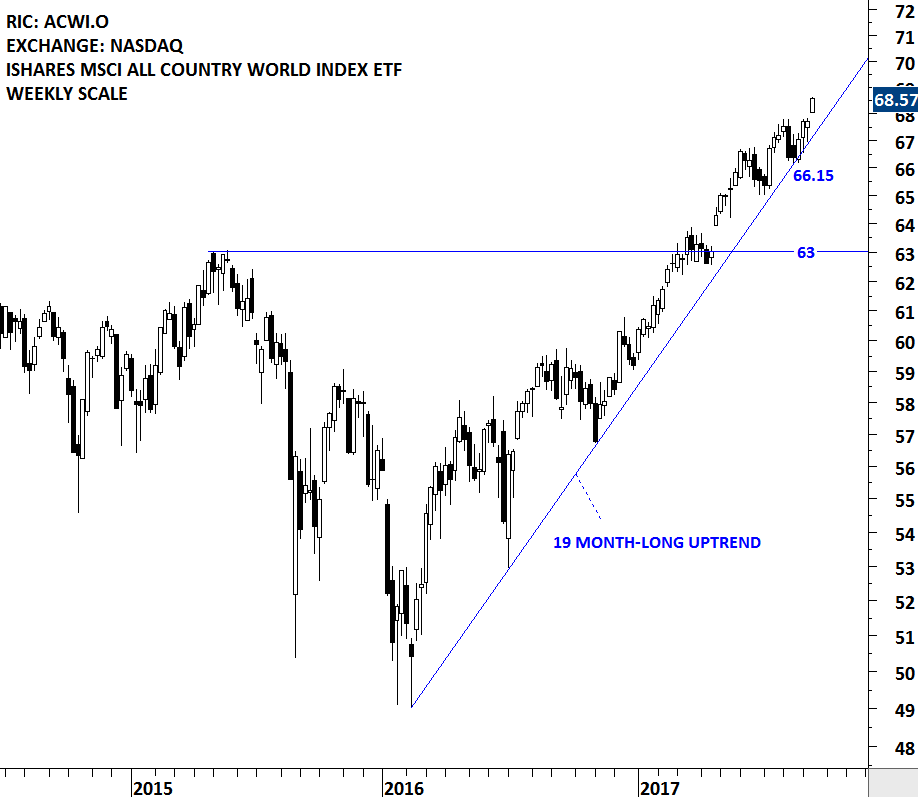
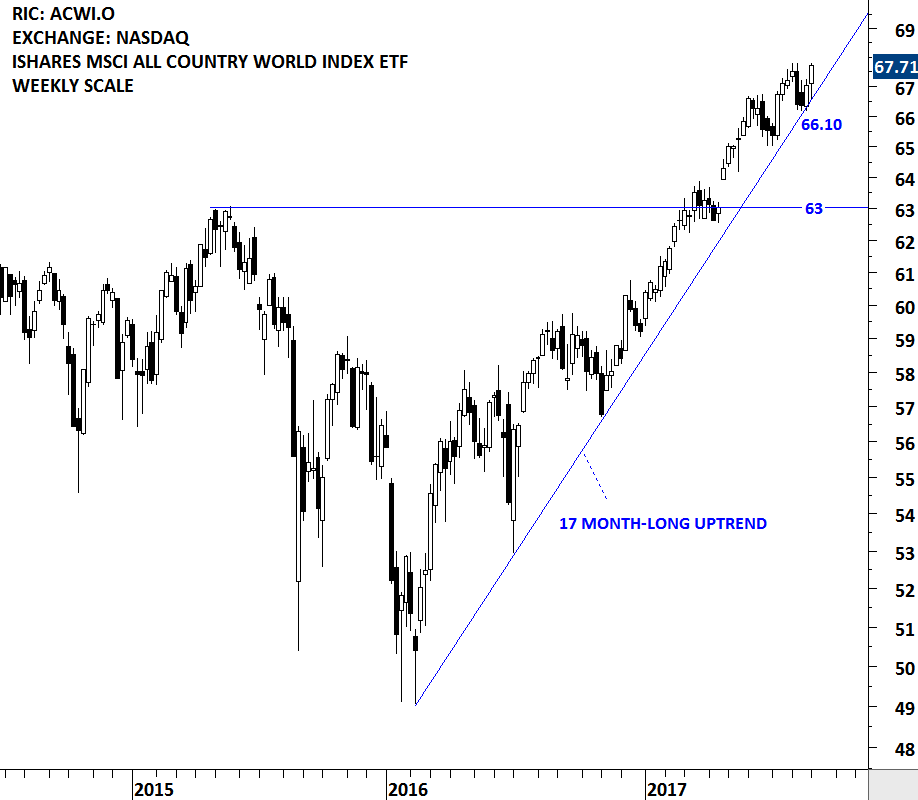
Global equity markets continue to remain in a steady uptrend. iShares MSCI All Country World Index, a benchmark for global equity market performance, continued to hold above its multi month-long upward trend line. The minor low and the upward sloping trend line are forming support at 66.15 levels. Uptrend is intact.

Thursday, September 21st at 11:00 am MST
Members of the Factor and/or Tech Charts Service join us for our first joint webinar with Peter Brandt and Aksel Kibar. Peter and Aksel will give examples of major chart patterns. They will discuss current trades that performed well and showcased classical charting patterns. Peter and Aksel will also discuss any current developing trades. As time allows we’ll end with member questions.
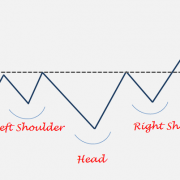
Head and shoulder chart pattern can form as a continuation on price charts. In uptrends, a H&S continuation will be similar to a H&S bottom and in downtrends it will resemble an inverse H&S. The implications and interpretations continuation H&S are usually the same with reversals. Price objectives can be derived in the same way as it is calculated on a reversal chart pattern.
Head and shoulder continuation is one of my favorite chart pattern. A head and shoulder continuation that forms in an uptrend, will usually breakout to all-time highs once the chart pattern is completed. Breakout to all-time highs from bullish continuation chart patterns are usually reliable and powerful.
A head and shoulder continuation that forms in a downtrend will usually take out the minor lows and move in the path of least resistance. Price that is already in a downtrend is likely to accelerate on the downside (sometimes in a sharp fall) as it breaks down a well-defined horizontal support.
Below are some examples of H&S continuation chart patterns in up and down trends.

I am not sure if Volatility index can be analyzed from a classical charting perspective but over the past few months, the VIX futures and since 2016, the CBOE Volatility Index respected important support/resistance levels. Irrespective of the headlines related to geopolitical tensions, the three different continuation future price charts of the Volatility Index (Oct, Nov, Dec) are showing signs of multi-month bottoming process. The importance of 15-16 area as a resistance can be seen on the Volatility Index and the VIX futures price charts. Last one month’s price action arguably formed tight consolidations in the form of a pennant/symmetrical triangle below the important horizontal resistance. I think we should keep a close eye on these charts in the coming weeks. Completion of the month-long tight consolidation range can result in a breakout above the strong resistance area between 15 and 16 levels.

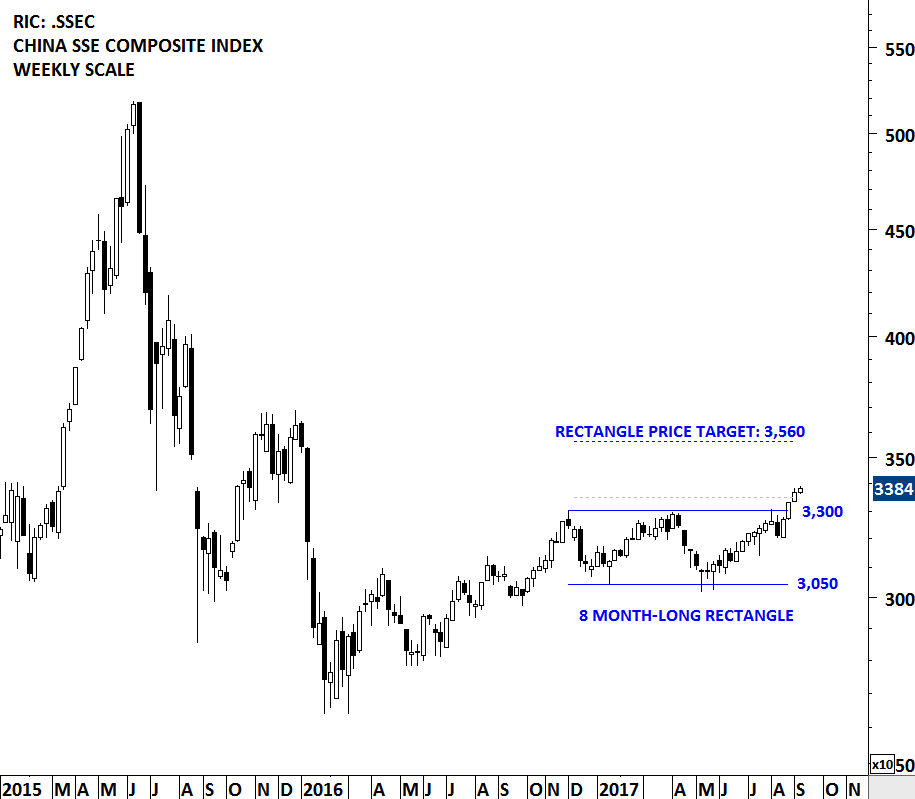
China SSE Composite has been forming an 8 month-long rectangle chart pattern. Over the past two weeks the index breached the upper boundary of its multi month-long rectangle chart pattern standing at 3,300 levels. The daily close above 3,350 levels confirmed the breakout with a possible chart pattern price target of 3,560 levels. Breakouts from chart patterns with horizontal boundaries are reliable. After a confirmed breakout, resistance becomes support. Strong support for the index now stands at 3,300 levels. Positive momentum in Chinese equities can boost Emerging Markets performance. (Learn more: Video Tutorial – Rectangle)

The iShares MSCI ACWI ETF seeks to track the investment results of an index composed of large and mid-capitalization developed and emerging market equities. It is a good measure of Global equity markets performance. The ETF is listed on the Nasdaq Stock Exchange. Over the past few weeks, the Global Equity Markets report reviewed the ACWI ETF and highlighted the importance of the multi-month uptrend and the trend line support. Last two week’s price action rebounded from the steep trend line support at 66.10 levels and challenged the all-time highs. The long-term up trend is still intact and the multi-month trend support has become even more important. The more a technical level is tested the more important that level becomes. For now, our conclusion is that, the benchmark for global equity market performance is still moving higher with an important support (minor low and multi-month upward trend line) standing at at 66.10 levels.

A stock (ETF, Index etc.) price is either in a trending phase or in a consolidation period. During strong trend periods prices move uninterrupted from one price level to another. During consolidations prices move in both directions without producing any meaningful or sustained price change and will form well-defined support and resistance areas on the charts. A support range represents a concentration of demand, and a resistance range represents a concentration of supply.
A resistance level is an approximate level or fairly well-defined price range, where previously advancing stock meets resistance in the form of strong selling. A support level is an approximate level or price range where a preceding decline meets support, in the form of strong buying. A possible explanation for appearance of such well-defined price boundaries in the form of support and resistance can be the fact that the public tend to remember previous levels the stock has traded.

