Review of Chart Pattern Reliability Stats for 2023 and YTD 2024 – March 2024 Tech Charts Member Webinar

Review of Chart Pattern Reliability Stats for 2023 and YTD 2024 - March 2024 Tech Charts Member Webinar

Webinar Outline
  • Review of chart pattern statistics and discussion on chart pattern reliability covering the YTD numbers, 2023 and 7 year historical stats
  • Review of global equity markets and latest opportunities
  • Review of opportunities in the cryptocurrency markets
  • Q&A

Live Questions from Members

  1. H&S continuation, can you walk through an example? 56:00
  2. What is the assumed stop loss used in the calculated success rates? If the success rate is based on a 20% negative move before reaching it, it is less meaningful. 1:00:24
  3. You emphasize the importance of seeing multiple "reactions" to the pattern boundary. On your charts, some "reactions" are sharp v-reversals; others are just a few candles of "hesitation." How do you personally define a valid "reaction" to a boundary? 1:02:21
  4. When do you move your stop to break even? 1:04:20
  5. Do you have stats for different markets? Is the success rate roughly the same if one doesn't trade all signals worldwide? 1:06:14
  6. What is your view on the current US$ Index (DXY)? 1:07:56
  7. What are your thoughts on Copper (symbol HGcv1 on Metastock)? 1:08:42
  8. In CVNA does price action have to correct itself after a gap up? 1:09:49
  9. What is your typical yearly ROI with your trading strategy? 1:11:04
  10. How do you manage your finances as a full-time trader? 11:11:43 (Helpful article on Factor's website, Peter L. Brandt - So you want to become a full-time trader )
  11. The markets are at all-time highs. How do you guide trades at this point? 1:12:00
  12. In a Type 4 breakout, what is the median, max and min loss you go for or have achieved? 1:12:43
Recorded live 03.21.2024 Read More

Review of Risk/Reward in Type 1 and Type 2 Breakouts – December 2023 Tech Charts Member Webinar

Review of Risk/Reward in Type 1 and Type 2 Breakouts - December 2023 Tech Charts Member Webinar

Webinar Outline
  • Review of chart pattern statistics and discussion on chart pattern reliability covering the 4th quarter of 2023 and YTD numbers
  • Review of global equity markets and latest opportunities
  • Breakouts after a minimum 3 tests of pattern boundaries and what we can expect around breakout levels.
  • How to manage Type 1 and Type 2 breakouts in order to maximize the potential of a breakout
  • Member questions

Live Questions from Members

  1. Can you let me know your thoughts on the FTSE 250 chart? 51:29
  2. What is the outlook for DXY in the near term? 52:51
  3. When multiple breakouts occur simultaneously, how do you choose which ones to trade? 54:13
  4. When does Aksel choose to use the 1.5% breakout rule, over the 3% rule? Is there a specific criteria for 1.5% instead of 3%, or does the eye simply judge it? 54:56
  5. Could we have a view/comment on the current metal run, particularly Gold, Copper, and silver, and the bearish nature of the USD. 55:52
  6. Do you take all trades with a clear pattern or only take trades with a clear pattern and a minimum reward-to-risk ratio? 57:17
  7. Do you use a screen/filter to identify a shortlist of charts from which you eyeball for patterns? 58:47
  8. Regarding the pattern statistics: Have you considered organizing pattern success rates by Exchange? My assumption is that Turkey and Japan had much higher than average win rates this year, while the U.S. had much lower. If one can only trade a single region, they likely experience very different success rates and must adjust accordingly. 59:36
  9. ATR STOP is based on 30 day ATR * 3? 01:00:39
  10. Do you only highlight breakouts that will be above the 200 day m.a.? 01:00:56
Recorded live 12.14.2023 Read More

Is Classical Charting Still Valid? – September 2023 Tech Charts & Factor Webinar

Is Classical Charting Still Valid? - September 2023 Tech Charts & Factor Webinar

Join Peter Brandt and Aksel Kibar as they answer this question. 

Webinar Outline
  • Chart pattern reliability statistics (what is performing better)
  • Looking at today's markets from Richard W. Schabacker's perspective
  • Markets of interests, what we are currently focusing on
  • More on classical charting principles
  • Q&A

Live Questions from Members

  1. Is this strategy scalable? Are there any scaled funds (>$1bn AUM) that use Classic Charting exclusively? 55:17
  2. Can this strategy be fully or partially automated via codifying the clearly defined classical charting defined principles? 58:08
  3. After I started to look at the Stochastic Oscillator, I realized that most breakout from patterns occurs when the indicator is overbought/sold on a higher timeframe. Doesn't this affect somehow the reliability of the breakout, with a higher probability of a false breakout when this situation presents itself? 59:34
  4. What does Profit Factor mean? 1:00:46
  5. What are your thoughts on trading classical patterns on intraday charts 1h, 4h or even on 15-min? 1:02:49
  6. Why do we focus so much on win rate (batting average). Don't we care more about "slugging percentage"? 1:05:04
  7. Please explain all the Breakout Types again 1:06:13
  8. I have a question for Peter. From your Factor Member alerts, I note that you rarely, if ever, trade the USDJPY (while Aksel's long-term chart shows a clear break out). I am curious to know if there is any reason or past experience or learning here? 1:07:47
  9. In the past statistics, is there any overlap of patterns - head and shoulders continuation and then ascending triangle overlapping at the breakout point? Are they both included in the stats, or do you maintain the longer duration pattern? 1:10:06
  10. Have you experienced a drawdown like this before? Is this typical in what you have seen in your past? And will you ever adjust your strategy during long stretches of losing trades? Are you sizing down during long losing streaks or shortening your PT or tightening/loosening risk? 1:11:13
  11. Do you ever consider sitting entirely in cash when the breadth of the market is the way it is, and not seeing your breakouts work? 1:13:21
  12. How many times will you let yourself reenter a position that stops you out and do you change the ATR breakout level? 1:13:32
  13. Instead of trading a Forex currency pair such as AUD/CAD is it possible to create a synthetic forex position by trading the futures contracts for AUD and CAD, being long AUD and short CAD if you were trying to long /CAD, and short AUD and long CAD if you were trying to be short AUD/CAD. 1:15:04
  14. To clarify, is Peter bearish on the Russell 2000? 1:16:47
  15. Is it a 200-period moving average on the DXY chart? 1:18:01
Recorded live 09.20.2023 Read More

Tech Charts Year in Review – Year Six, May 2023 Webinar

Tech Charts Year in Review. Aksel compares the before and after of charts shared with Members over the last year followed by a live Q&A. Tech Charts Year in Review – Year Six
  • A study on Chart Pattern Reliability with the available sample data over the past year.
  • H&S continuation has been the most reliable chart pattern over the past year. Rectangle continued to be in the top 3 reliable chart patterns.
  • Detailed statistics on different types of breakouts.
  • The impact of different market cycles on chart pattern opportunities.
  • Live Q&A
Live questions from Members
  1. Last year, you said 2022 was the most difficult period for breakout trading of the last six years. Many breakout traders implement "sit out" periods where they stop trading in adverse market environments. Others use Progressive Exposure to size up or size down based on how well breakouts are performing. Do you use either of these tactics? 46:42
  2. On type 3 breakouts, are you getting stopped out and then reentering? 48:19
  3. It seems like some of your setups are based on the profit target and where your stop or pattern negation level are placed, that your risk-reward ratio is less than 1. Can you clarify some of those charts and if you're taking these trades or if you're charting what you see on the chart? 49:02
  4. Do you use a trailing stop once price action has moved toward your price target favorably to avoid a loss on something that has moved so much in the favorable direction 50:04
  5. Where are you placing your stops on the chart patterns you use? Like Head and shoulders, rectangles, Cup and handles, triangles, etc? 50:50
  6. What are your thoughts on the current formation of the Gold futures chart? I see a confirmed double top on the daily, but the pattern is small. Would you think it's too small of a pattern to trade? Thoughts on the position of gold's price? 51:52
Educational videos mentioned in this webinar Recorded live 05.24.2023 Read More

How To Utilize Support & Resistance in Different Trade Setups – March 2023 Tech Charts Webinar

How To Utilize Support & Resistance in Different Trade Setups - March 2023 Tech Charts Webinar

We are continuing our Member webinar series with chart pattern reliability and how the latest market conditions have impacted success rates on different chart patterns. Webinar Outline
  • Review of chart pattern statistics and discussion on chart pattern reliability covering the first quarter of 2023
  • Review of global equity markets and latest opportunities
  • Support and Resistance levels & actionable breakout/breakdown points on each classical chart pattern that is covered under Educational Videos
  • Education/analysis of fine points on classical charting as we go through different charts/questions
Read More

Stop-limit order and early entry

This content is for members only

Review of Chart Pattern Reliability Statistics – December 2022 Tech Charts Webinar

Review of Chart Pattern Reliability Statistics - December 2022 Tech Charts Webinar

We are continuing our Member webinar series with chart pattern reliability and how the latest market conditions have impacted success rates on different chart patterns. We plan to have an interactive session and an open discussion to answer members' questions on different markets and specific charts of interest.

Webinar Outline

  • Review of chart pattern statistics and discussion on chart pattern reliability covering the fourth quarter of 2022
  • Review of global equity markets and latest opportunities
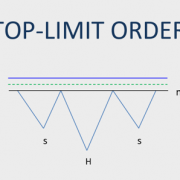
  • Stop-limit orders and ideas on scaling in during breakouts and how it changes the risk/reward
  • Open discussion answering member's questions on different markets and specific charts they want to discuss
  • Education/analysis of fine points on classical charting as we go through different charts/questions

Live questions from Members

  1. New member here. I like your data on win rate by pattern and breakout type. I know your targets are based on the chart patterns but have you looked at risk-reward ratios on your trades? In this current environment, I am happy taking some profits at 2:1 and thrilled when a 3:1 reward to risk is achieved. Also, how much risk do you place on a trade? Is it similar to Peter Brandt, and is it a certain percentage of account equity? 47:55
  2. I remember seeing on Aksel's Twitter that he used a quiz to teach about movements and patterns. I found it very didactic to learn technical analysis. Are these quizzes also in the members' area? 49:17
  3. SLIDE 43 - Where to check, ema or sma? 49:55 
  4. Re. Gold: Looking at the monthly chart, can you comment on possible cup & handle? 50:45
  5. Do you look at sectors and main trend in the market when deciding to take a trade? 51:16
  6. How do you rate the technical situation of XETRA DAX? 52:25
  7. How much importance do you give to institutional investors scaling in the stocks and how do you go about noticing their process? 53:14
  8. For looking at chart daily or weekly or monthly? 54:52
  9. In the poorly trending market would you suggest a tighter SL (high R:R, low win rate) or wider SL (Low R:R, high win rate) or is the strength of the market not relevant to SL positioning? 56:02
  10. What time of day do you trade? Always at or near closing price? 56:59
  11. How to know which support or res? right or wrong. 57:45

Educational Videos mentioned in this webinar 

Recorded live 12.15.2022  Read More

Review of Chart Pattern Reliability Statistics and Opportunities in Global Markets – September 2022 Tech Charts Webinar

Review of Chart Pattern Reliability Statistics and Opportunities in Global Markets - September 2022 Tech Charts Webinar

We are continuing our Member webinar series with chart pattern reliability and how the latest market conditions have impacted success rates on different chart patterns. We plan to have an interactive session and an open discussion to answer members' questions on different markets and specific charts of interest. Webinar Outline
  • Review of chart pattern statistics and discussion on chart pattern reliability covering the third quarter of 2022
  • Review of global equity markets and latest opportunities
  • Review of cryptocurrencies and latest opportunities
  • Open discussion answering member's questions on different markets and specific charts they want to discuss
  • Education/analysis of fine points on classical charting as we go through different charts/questions

Live questions from Members

  1. India has been in a sideways movement for a year. I know you've featured a bunch of names from here. Do you see this EM as an outlier of strength amongst most EMs? 48:45
  2. I have been looking at the crypto ticker XLM/USD and XLM/BTC. It seems to be setting up a strong bottom. 49:39
  3. I see you use MetaStock. Is there any specific reason? 51:08 (LINK for MetaStock)
  4. Do you only trade the chart patterns? Do you wait for the confirmation for the price close? What do you do when closing diminishes the Risk reward relationship? 52:14
  5. Would you be able to give me a stop loss (as you would use) for your India positions? 53:20
  6. Can you go over the breakout setup in NOC? 55:06 (LINK ATR TRAILING STOP-LOSS
  7. How important is EEM nowadays? Isn't it mostly made up of China tech? Isn't it better to look at individual EM ETFs rather than EEM? 57:05
  8. In your weekly report for some index or stocks, you are using DEMA200 or DSMA200. It's a bit confusing which one to use. 57:43
  9. Yen had a crazy day today. 58:03
  10. Your thoughts on the continuing strength of the U S Dollar & its effect globally? 58:05
  11. Could you give us your view on EWZ (brazil) and also an update on NIKKEI? It looks like a bull trap confirmed above the rectangle breakout. 59:38
  12. Can you summarize any charts that look bullish? Everything seems bearish. 01:01:43
  13. Can you please chart BBBY on daily? Is that a falling wedge from 8/17 to the present day? 01:02:08
  14. How do you trade Turkey ETF? On a USD or at a TRY base? 01:03:51
  15. On the BBBY monthly, is that a double bottom? 01:05:15

Educational Videos mentioned in this webinar 

Recorded live 09.22.2022  Read More

Tech Charts Year in Review – Year Five, May 2022 Webinar

Tech Charts Year in Review. Aksel compares the before and after of charts shared with Members over the last year followed by a live Q&A. Tech Charts Year in Review – Year Five
  • A study on Chart Pattern Reliability with the available sample data over the past year.
  • Rectangle has been a reliable chart pattern with the H&S variations. Examples and studies on those reliable patterns.
  • Detailed statistics on different types of breakouts.
  • The impact of different market cycles on chart pattern opportunities.
  • Live Q&A
Live questions from Members
  1. SLIDE 5 - I only look for patterns that begin with a pivot point countering the preceding trend. However, I see on slide 5 that you've labeled the pattern beginning with two lower pivots after an uptrend. Am I being too rigid in defining my patterns? 50:55
  2. SLIDE 8 - In a Type 4 breakout, if the price reverses down and the negation level is hit, but the price then rebounds/recovers and breaks out again, why is the chart pattern destroyed? 52:20
  3. How is the breakout confirmation price calculated? 54:21 (Technical Analysis of Stock Trends, 5th Edition, Edwards and Magee) 
  4. In Peter Brandt's book "Diary of a Professional Commodity Trader: Lessons from 21 Weeks of Real Trading," he described the average duration of some classic patterns; my question is: do you have your own durations for classic chart patterns, or is the average duration universal to all classic chart patterns? 55:35 (Diary of a Professional Commodity Trader, Peter L. Brandt) 
  5. Do you take profits once a chart reaches its target, or do you let the trade run until you see signs of reversals? 56:35
  6. How many concurrent positions do you recommend a breakout trader hold? I'm reading the Mark Minervini books from your reading list, and he recommends holding no more than 4 positions (non-margined) to 8 positions (fully margined). Do you recommend similarly? 57:40
  7. I just want to make sure I understand that 1. the success rate is calculated from subjectively identified inside pattern minor price points? and hence 2. the success rate showed here has nothing to do with my trading success rate because everyone's stop level can be different? so 3. if that's the case, what's the point of calculating the success rate here unless we all use that minor point inside the pattern as a stop level? 59:03
Recorded live 05.19.2022 Read More

Chart Pattern Reliability & Review of Current Market Opportunities – March 2022 Tech Charts Webinar

Chart Pattern Reliability & Review of Current Market Opportunities - March 2022 Tech Charts Webinar

We are continuing our Member webinar series with chart pattern reliability and how the latest market conditions have impacted success rates on different chart patterns. Webinar Outline
  • Review of chart pattern statistics and discussion on chart pattern reliability covering the first quarter of 2022
  • Review of markets and latest opportunities
  • Open discussion on answering members’ questions on different markets and specific charts they want to discuss
  • Education/analysis of fine points on classical charting as we go through different charts/questions

Live questions from Members

  1. SLIDE 3 - Is it possible to publish this data only for the US market? 01:07:37
  2. SLIDE 14 - When drawing the channel's lower boundary, I would have used the lows in 2014 and 2018 to connect the trendline. What made you confident ignoring those lows? 01:08:38
  3. Can you look at praj.ns. listed on the NSE in India? A rectangle with a premature breakout and now trying again? 01:10:46
  4. Do you use a minimum volume threshold to determine which ETFs make it into your asset universe? 01:12:17
  5. Do you believe AKAM is a valid rectangle? 01:13:21
  6. Do you have plans to add commodities to your reports? 01:14:35
  7. ARES chart, please. 01:14:54
  8. Do you adjust stock data for dividends? 01:16:12
  9. Is there technically a proper H&S top on ADBE? 01:17:42
  10. Another stock you've covered in the past is Indian hotel listed on NSE...another breakout rectangle breaking? 01:18:57
  11. When you wait for the 3% breakout threshold, do you only buy on the next day or at the close? 01:20:19

Educational Videos mentioned in this webinar 

Recorded live 03.31.2022  Read More