
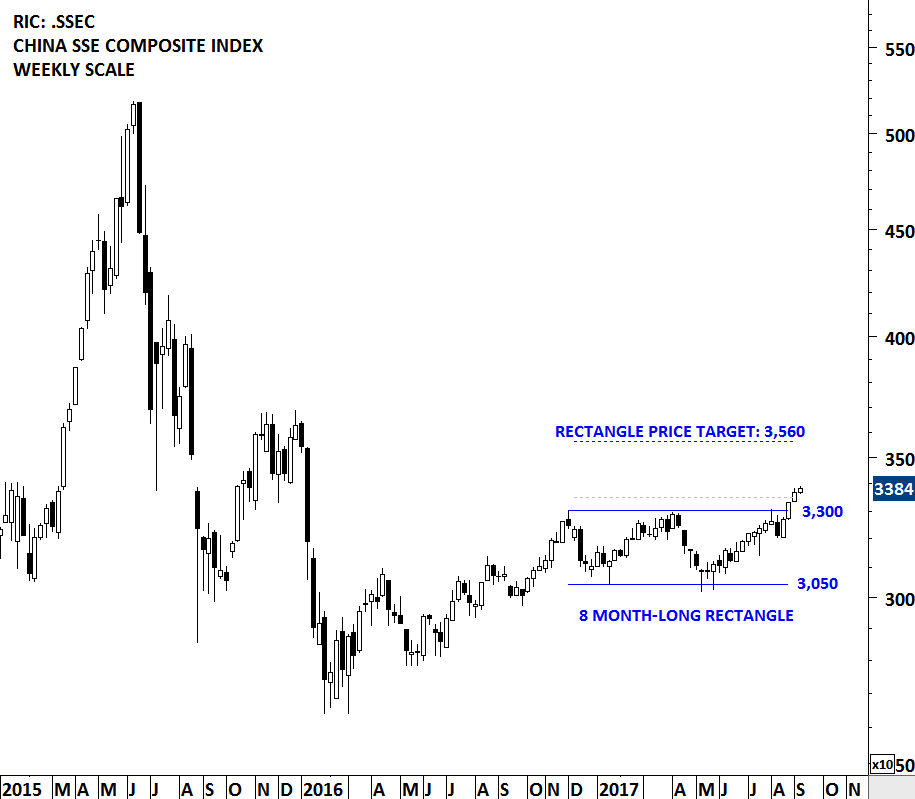
CHINA SSE COMPOSITE INDEX
China SSE Composite has been forming an 8 month-long rectangle chart pattern. Over the past two weeks the index breached the upper boundary of its multi month-long rectangle chart pattern standing at 3,300 levels. The daily close above 3,350 levels confirmed the breakout with a possible chart pattern price target of 3,560 levels. Breakouts from chart patterns with horizontal boundaries are reliable. After a confirmed breakout, resistance becomes support. Strong support for the index now stands at 3,300 levels. Positive momentum in Chinese equities can boost Emerging Markets performance. (Learn more: Video Tutorial – Rectangle)
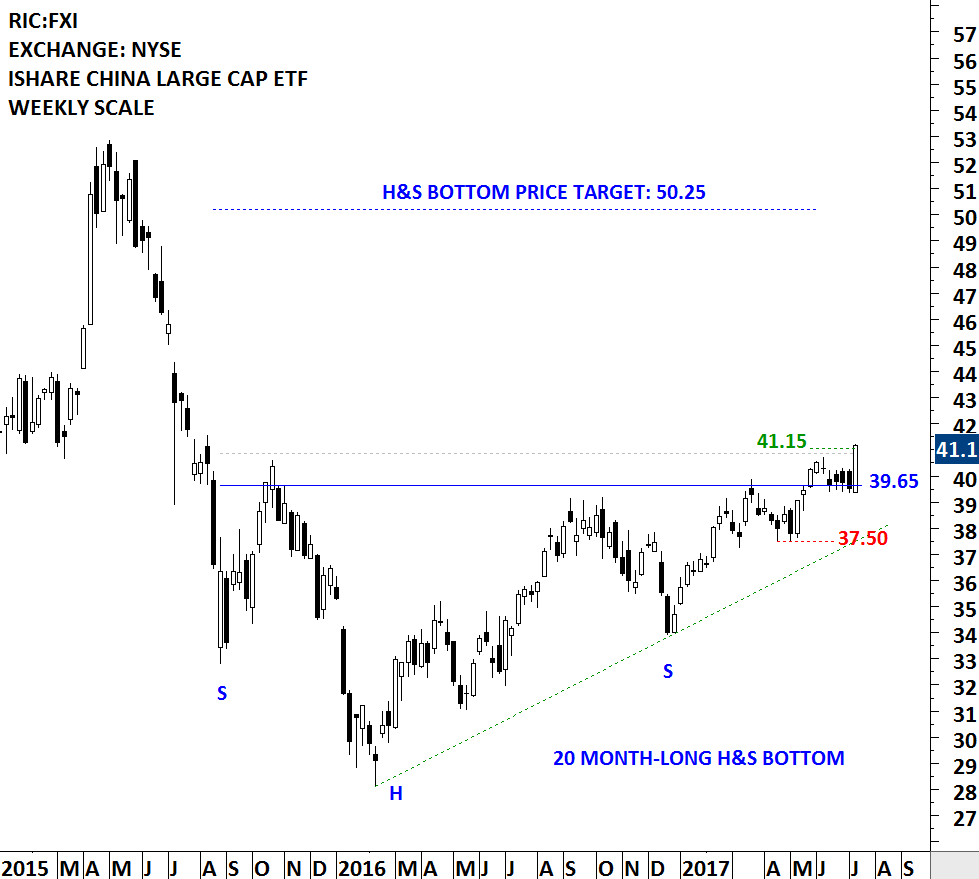
Tech Charts members were alerted to the bullish chart pattern breakout signal and the developing strength in the Chinese equities in the Interim Update of July 13, 2017. The report discussed the strong price action on the iShares China Large Cap ETF (FXI). With the completion of the 8 month-long bullish rectangle on the SSE Composite index (benchmark for broad market performance), strength in the Chinese equities can be seen in small and mid-caps as well as large-caps. The two charts below show the FXI at the time of the breakout alert (left) and with this week’s updated prices (right). FXI has a possible chart pattern price target standing at 50.25 levels.

Tech Charts Membership

By becoming a Premium Member, you’ll be able to improve your knowledge of the principles of classical charting.
With this knowledge, you can merge them with your investing system. In fact, some investors use my analyses to modify their existing style to invest more efficiently and successfully.

As a Premium Member of Aksel Kibar’s Tech Charts,
You will receive:
-
Global Equities Report. Delivered weekly.
-
Classical charting principles. Learn patterns and setups.
-
Actionable information. Worldwide indices and stocks of interest.
-
Risk management advice. The important trading points of each chart.
-
Information on breakout opportunities. Identify the ones you want to take action on.
-
Video tutorials. How patterns form and why they succeed or fail.
-
Watch list alerts. As they become available so you can act quickly.
-
Breakout alerts. Usually once a week.
-
Access to everything (now and as it becomes available)o Reports
o Videos and video series -
Multi-part webinar course. You learn the 8 most common charting principles.
-
Webinars. Actionable and timely advice on breaking out chart patterns.
For your convenience your membership auto renews each year.


