Posts

GLOBAL EQUITY MARKETS – September 1, 2018

REVIEW


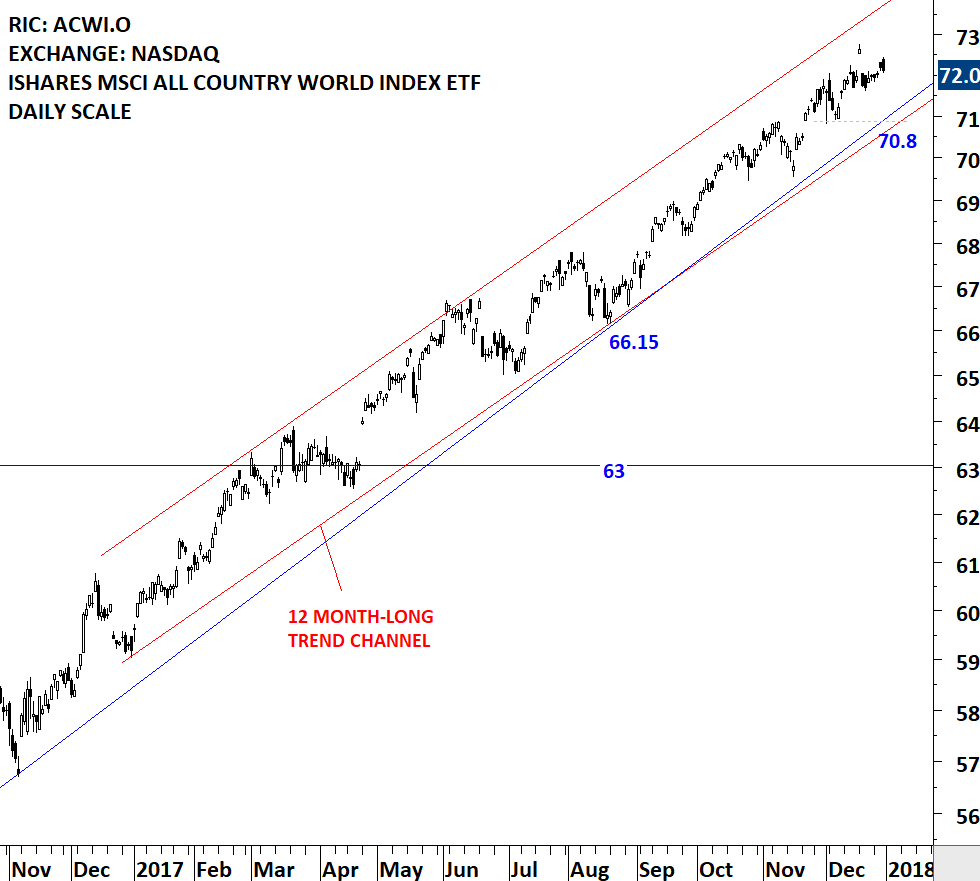
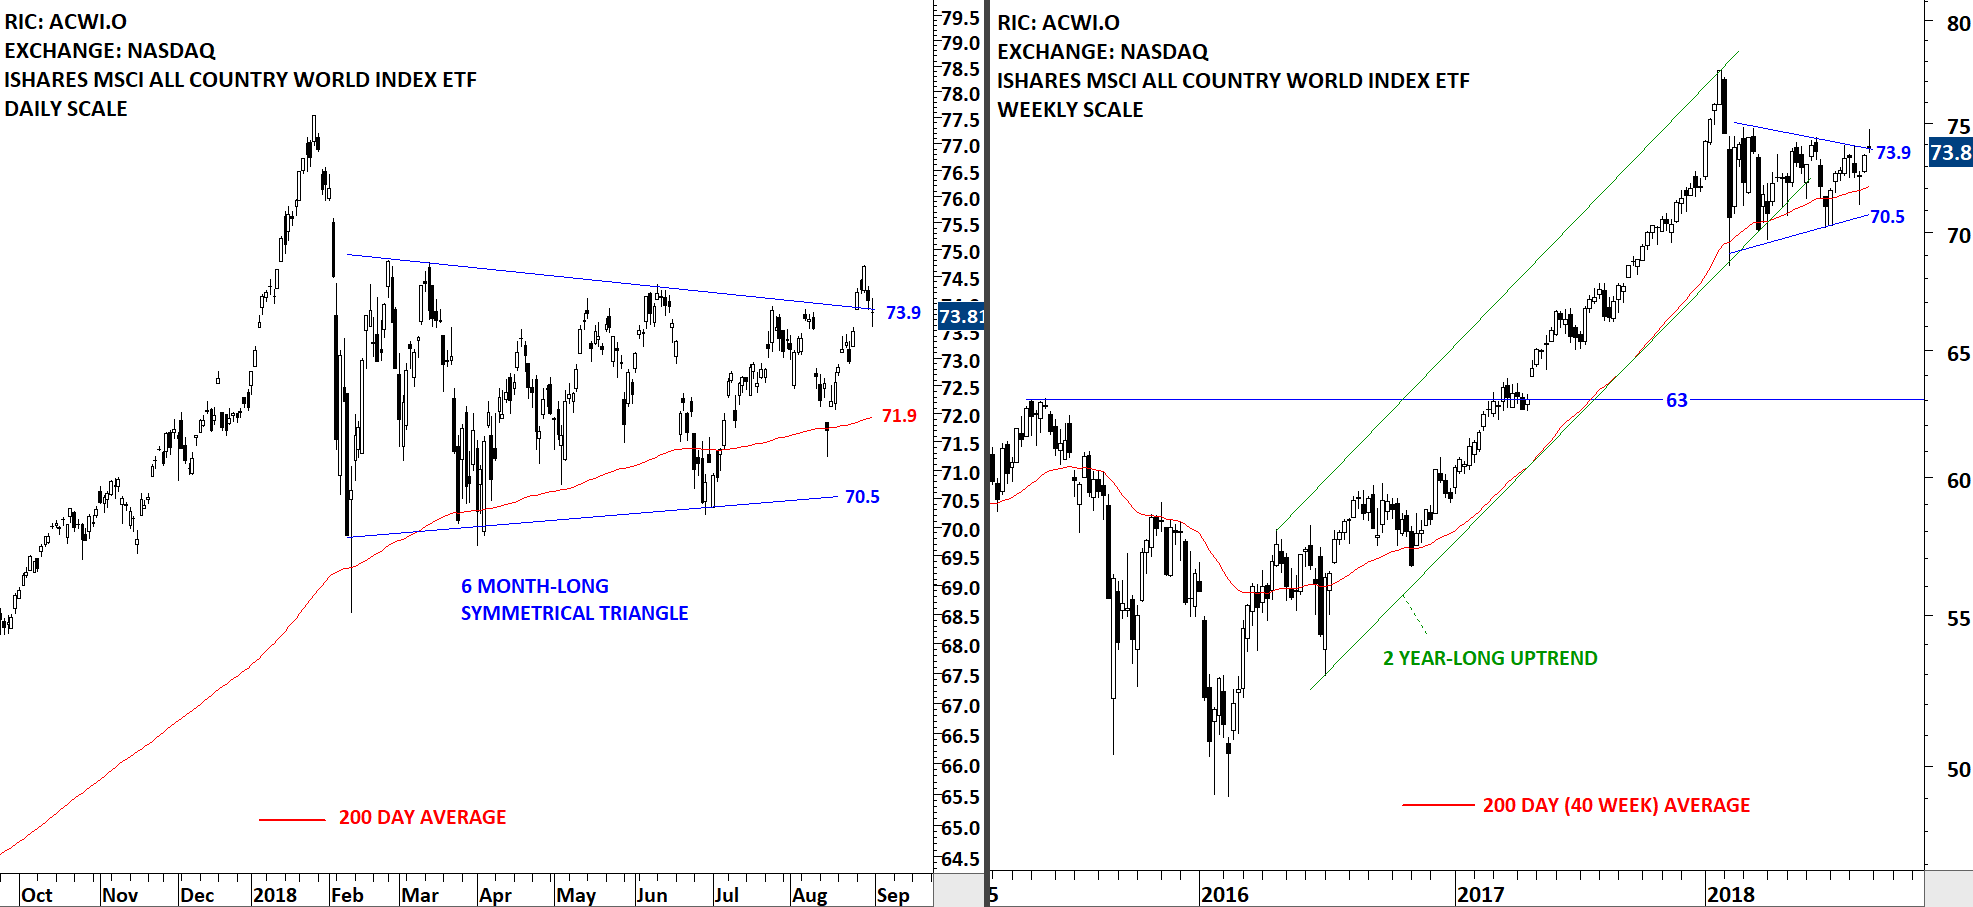
The iShares MSCI All Country World Index ETF (ACWI.O) breached the upper boundary of its 6 month-long symmetrical triangle. The upper boundary is acting as resistance at 73.9 levels. The jury is still out. We need to see a follow through in the following week to call for a breakout from the lengthy sideways consolidation. This week's price action can be a premature breakout that can be followed by a secondary completion. More on: Premature & False breakouts

Read More

GLOBAL EQUITY MARKETS – August 18, 2018

REVIEW


Global Equity Markets continue to remain in a range. The iShares MSCI All Country World Index ETF (ACWI.O) is possibly forming a 6 month-long symmetrical triangle with the upper boundary acting as resistance at 74 and the lower boundary as support at 70.5 levels. Breakout from this lengthy consolidation range will result in a directional move.

Read More

GLOBAL EQUITY MARKETS – November 11, 2017

REVIEW


During established up trends pullback to the long-term averages are considered to be low risk entry points. A widely followed trend indicator is the 200 day moving average. Price action above the 200 day moving average is recognized as an uptrend, while price trading below the 200 day (40 week) average is considered to be a downtrend. In the last quarter of 2016, the Euro Stoxx Banking index breached its long-term average on the upside what was considered to be the beginning of a possible uptrend. Since then, each pullback found support at the long-term moving average, confirming the steady uptrend. Over the past 5 months, the Euro Stoxx Banking index formed a sideways consolidation that can be identified as a symmetrical triangle. Read More

CHINA SSE COMPOSITE INDEX

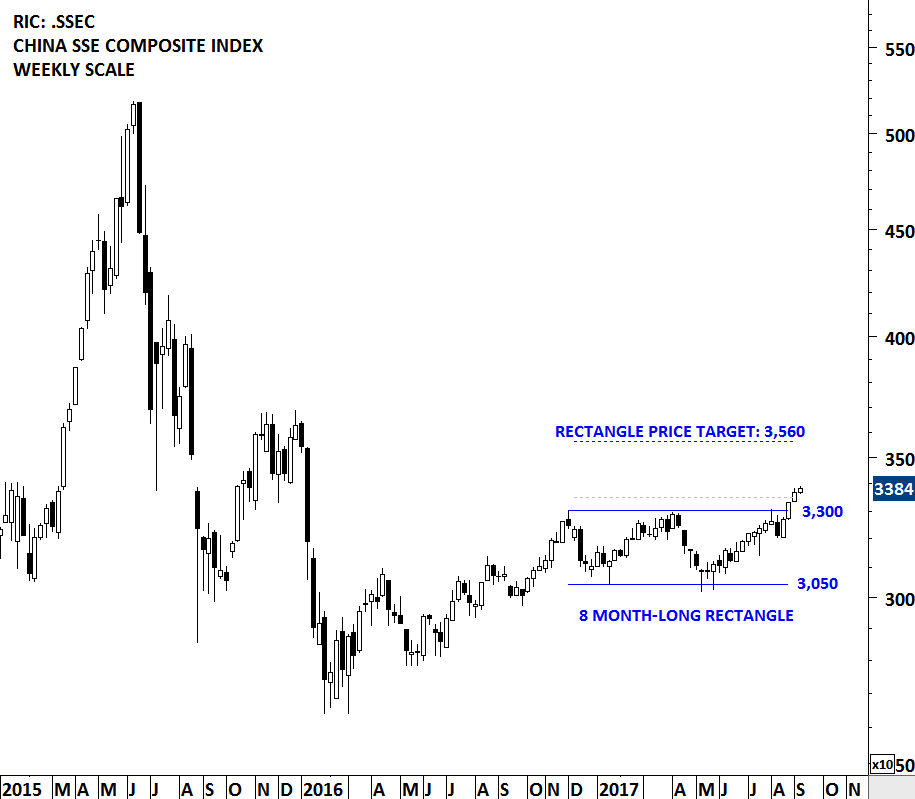
China SSE Composite has been forming an 8 month-long rectangle chart pattern. Over the past two weeks the index breached the upper boundary of its multi month-long rectangle chart pattern standing at 3,300 levels. The daily close above 3,350 levels confirmed the breakout with a possible chart pattern price target of 3,560 levels. Breakouts from chart patterns with horizontal boundaries are reliable. After a confirmed breakout, resistance becomes support. Strong support for the index now stands at 3,300 levels. Positive momentum in Chinese equities can boost Emerging Markets performance. (Learn more: Video Tutorial - Rectangle)

Read More

GLOBAL EQUITY MARKETS – August 26, 2017

REVIEW


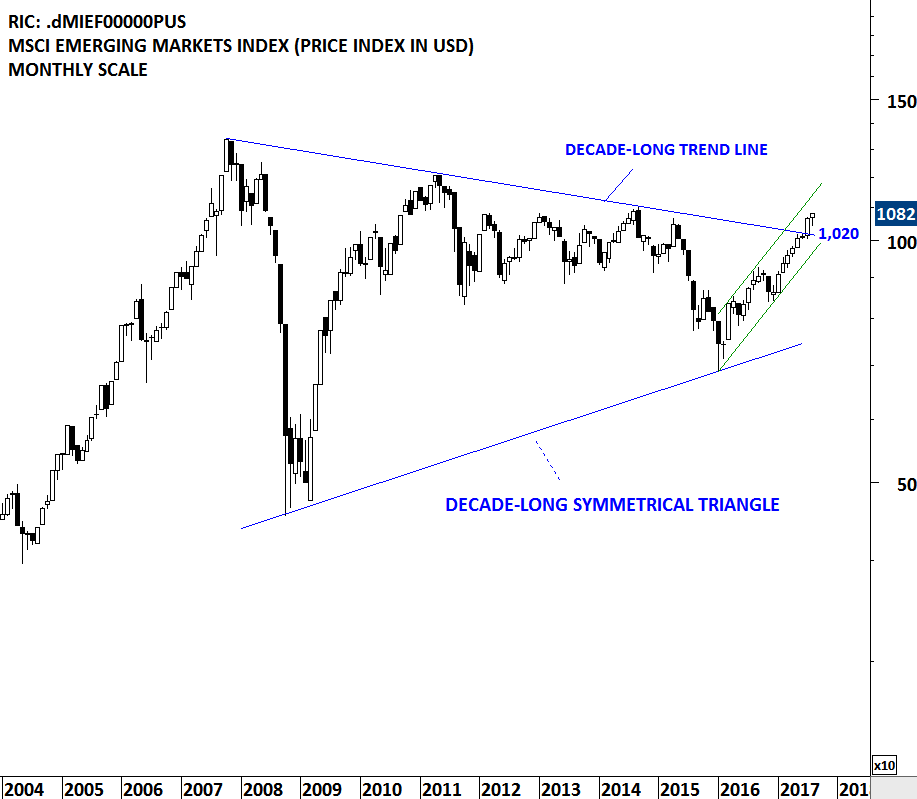
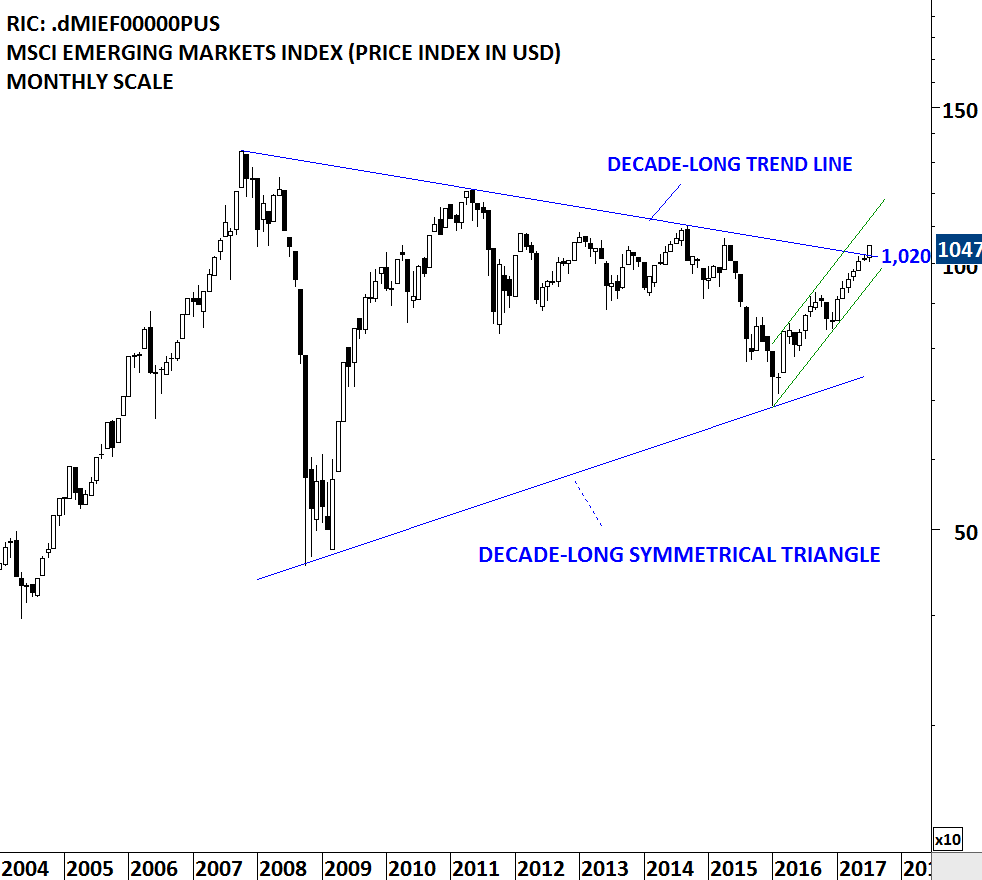
Strong weekly performance of the Chinese SSE Composite Index is worth mentioning in this weeks update. Strength in the Chinese equities helped MSCI Emerging Markets Index to remain resilient during the last few week's of global equity market weakness. MSCI Emerging Markets index that cleared decade-long trend resistance in July, held on to its earlier gains during the month of  August.

Read More

GLOBAL EQUITY MARKETS – July 15, 2017

REVIEW


Global equities had a strong performance led by Emerging Market equities and mainly Chinese Large-caps. MSCI Emerging Markets Index breached its decade-long trend line resistance at 1,020 levels. Tech Charts Global Equity Markets reports drew attention to the developing strength in Emerging Asia equities. Following the strong performance of S.Korea, Taiwan, India and Philippines, Chinese equities are also joining the list. An interim update was sent out during the week discussing the strong breakout on the Ishares China Large Cap ETF (FXI). Below charts feature the MSCI Emerging Markets Index (Price index in USD) and the New York Stock Exchange listed iShares MSCI Emerging Markets ETF (EEM).

Read More

INTERIM UPDATE – July 13, 2017

ISHARES CHINA LARGE CAP ETF (FXI)

A major chart pattern development is taking place on the Chinese equity ETF that is listed on the New York Stock Exchange. Ishares China Large Cap ETF is possibly completing a major 20 month-long base formation. Multi-month H&S bottom chart pattern has a neckline at 39.65 levels. Breakout attempt in the first quarter of 2017, was followed by a short-term set-back that found support at the neckline. However, during this week we can see that the China Large Cap ETF gained momentum once again. Read More