Posts

GLOBAL EQUITY MARKETS – December 14, 2019

REVIEW


The benchmark for the Global equity markets performance, the iShares MSCI All Country World Index ETF (ACWI.O) cleared the resistance at 77.5 levels. After a week of short-term volatility and pullback the ETF resumed higher towards its possible rectangle chart pattern price target at 79.6 levels. Both the daily and weekly price charts show a steady uptrend.

Read More

GLOBAL EQUITY MARKETS – November 16, 2019

REVIEW


The benchmark for the Global equity markets performance, the iShares MSCI All Country World Index ETF (ACWI.O) remained strong and close to the resistance level at 77.5 levels. The ETF found short-term resistance around 77.5 levels. The 5 month-long rectangle price target stands at 79.6 levels. Breakout above the minor resistance can push the ETF towards the price target at 79.6. Both the daily and weekly price charts show a steady uptrend. 74.8 levels will act as support during any pullback.

Read More

GLOBAL EQUITY MARKETS – December 8, 2018

Announcement: Dear Tech Charts members, We have included a new feature to Tech Charts website. At the bottom of each report we have incorporated comment platform DISQUS. Previous comment platform was not allowing members to post charts and have discussions. With this improvement, I hope to have detailed discussions with our members and possibly post breakout alerts related to each week's report. I also hope that Tech Charts members will be able to interact with each other through the DISQUS platform (at the bottom of each weekly report) to share their knowledge on different instruments available to take advantage of breakout opportunities. I hope we will all benefit from this new feature.

REVIEW


Global equity markets performance as measured by the iShares MSCI All Country World Index ETF (ACWI.O) reversed from its long-term moving average resistance at 71.3 levels. In the beginning of October the index broke down its 7 month-long consolidation and the 200-day moving average. Since then the ETF has challenged the strong resistance area between 71 and 71.5 levels but failed to breach higher. This week's sell-off pulled the ACWI ETF towards the minor support at 66.5 levels. Failure to hold above the short-term support can send the index to the next level at 63 levels. The iShares MSCI All Country World Index ETF is trading below its long-term average and is in a downtrend.

Read More

GLOBAL EQUITY MARKETS – January 20, 2018

REVIEW


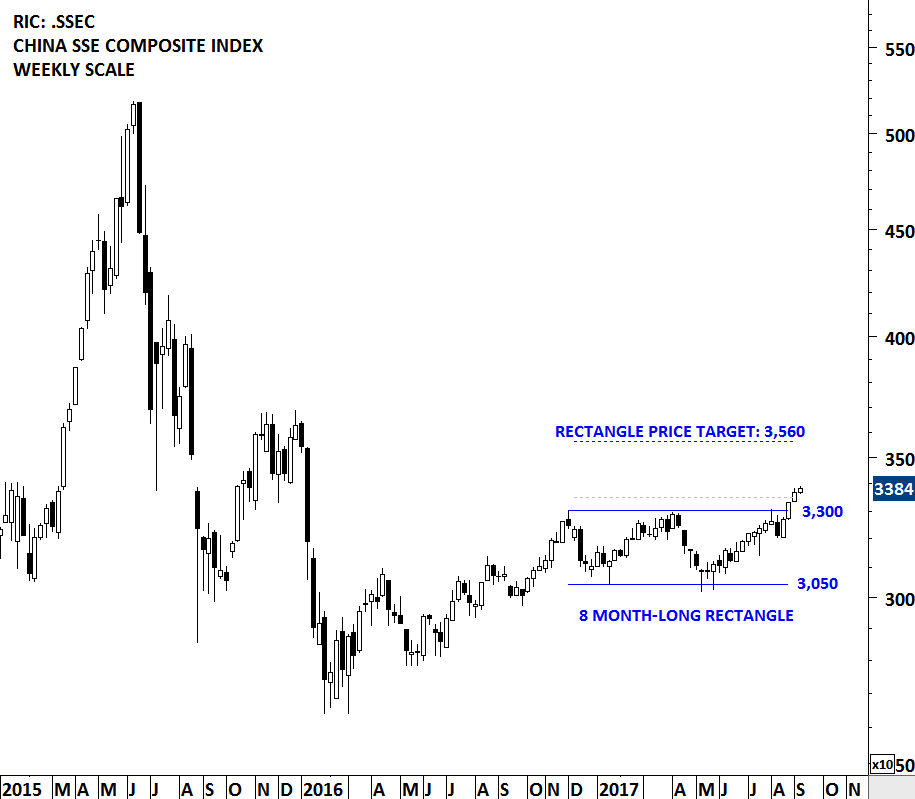
Strength in the Chinese equities started with a breakout on the China Large Caps. However, over the past year the performance for the broad market in China as shown by the China SSE Composite Index was not impressive when compared with China Large Cap ETF (FXI). In the second half of 2017, the SSE Composite index completed an 8 month-long rectangle. Following the breakout the index lacked follow through. SSE Composite Index spent the second half of 2017 by pulling back to the chart pattern boundary at 3,300 levels and to the long-term 200 day (40 week) moving average. Since the beginning of the year we have seen a strong performance on the SSE Composite Index with strong back to back weekly gains. Initial price target for the 8 month-long rectangle stands at 3,560 levels. More important than the short-term price target, current technical outlook might be signaling a new multi-month long uptrend developing for the Chinese equities.

Read More

GLOBAL EQUITY MARKETS – November 11, 2017

REVIEW


During established up trends pullback to the long-term averages are considered to be low risk entry points. A widely followed trend indicator is the 200 day moving average. Price action above the 200 day moving average is recognized as an uptrend, while price trading below the 200 day (40 week) average is considered to be a downtrend. In the last quarter of 2016, the Euro Stoxx Banking index breached its long-term average on the upside what was considered to be the beginning of a possible uptrend. Since then, each pullback found support at the long-term moving average, confirming the steady uptrend. Over the past 5 months, the Euro Stoxx Banking index formed a sideways consolidation that can be identified as a symmetrical triangle. Read More

CHINA SSE COMPOSITE INDEX

China SSE Composite has been forming an 8 month-long rectangle chart pattern. Over the past two weeks the index breached the upper boundary of its multi month-long rectangle chart pattern standing at 3,300 levels. The daily close above 3,350 levels confirmed the breakout with a possible chart pattern price target of 3,560 levels. Breakouts from chart patterns with horizontal boundaries are reliable. After a confirmed breakout, resistance becomes support. Strong support for the index now stands at 3,300 levels. Positive momentum in Chinese equities can boost Emerging Markets performance. (Learn more: Video Tutorial - Rectangle)

Read More

GLOBAL EQUITY MARKETS – September 2, 2017

REVIEW


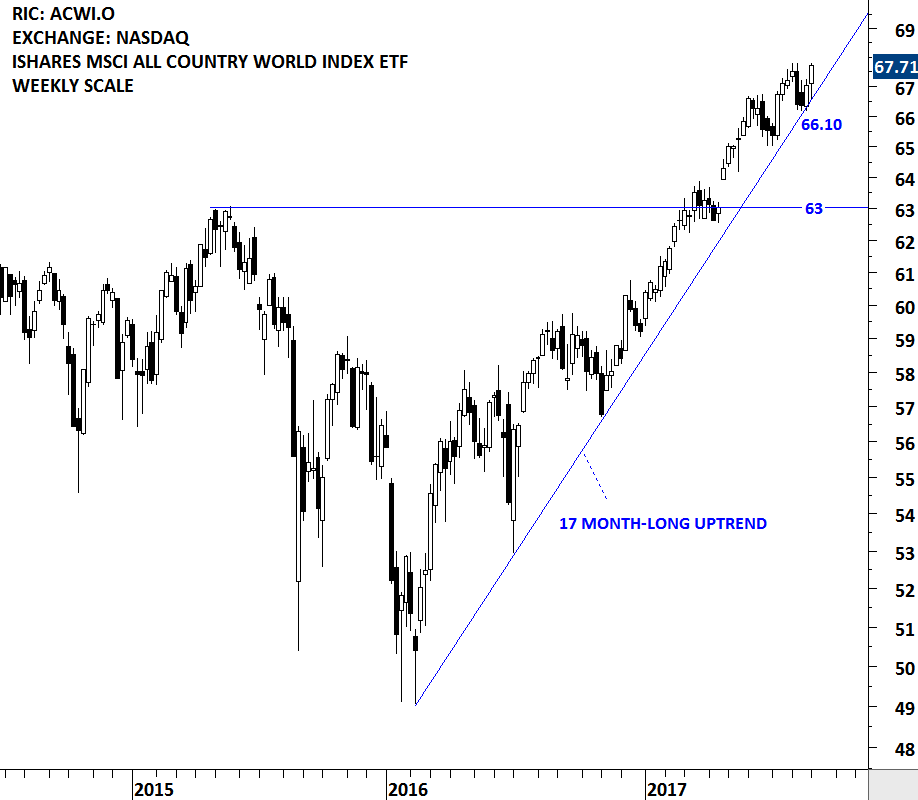
The iShares MSCI ACWI ETF seeks to track the investment results of an index composed of large and mid-capitalization developed and emerging market equities. It is a good measure of Global equity markets performance. The ETF is listed on the Nasdaq Stock Exchange. Over the past few weeks, the Global Equity Markets report reviewed the ACWI ETF and highlighted the importance of the multi-month uptrend and the trend line support. Last two week's price action rebounded from the steep trend line support at 66.10 levels and challenged the all-time highs. The long-term up trend is still intact and the multi-month trend support has become even more important. The more a technical level is tested the more important that level becomes. For now, our conclusion is that, the benchmark for global equity market performance is still moving higher with an important support (minor low and multi-month upward  trend line) standing at at 66.10 levels.

Read More

GLOBAL EQUITY MARKETS – August 26, 2017

REVIEW


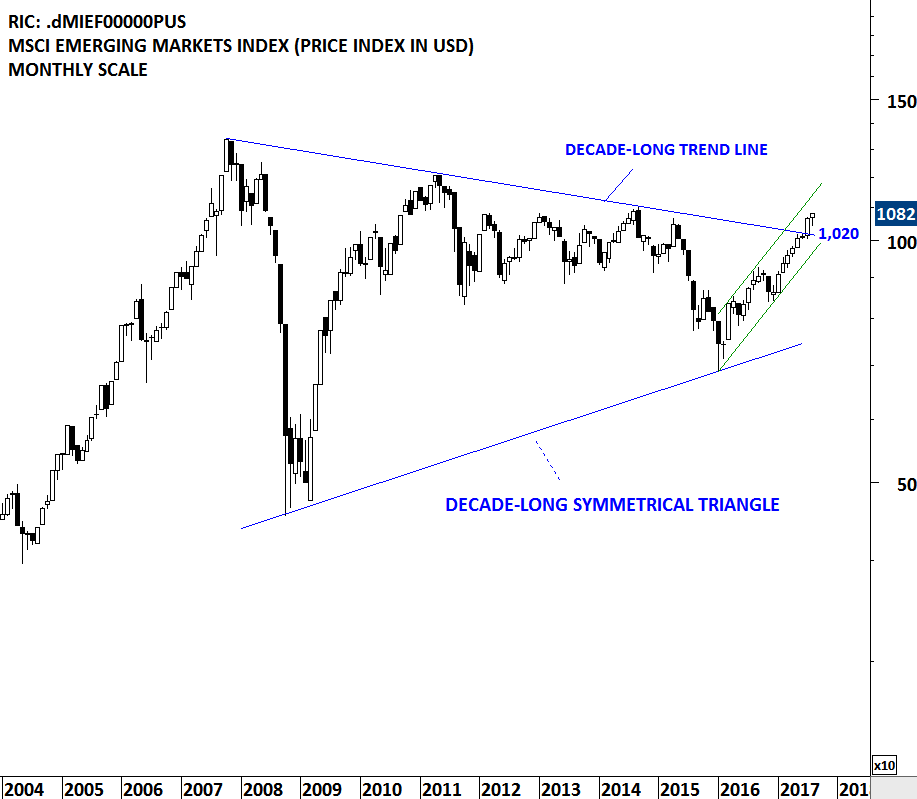
Strong weekly performance of the Chinese SSE Composite Index is worth mentioning in this weeks update. Strength in the Chinese equities helped MSCI Emerging Markets Index to remain resilient during the last few week's of global equity market weakness. MSCI Emerging Markets index that cleared decade-long trend resistance in July, held on to its earlier gains during the month of  August.

Read More