
PREMATURE & FALSE BREAKOUTS
Below two paragraphs are taken from Peter L. Brandt’s Diary of a Professional Commodity Trader – Lessons from 21 weeks of real trading.
“A premature breakout is different from an out of line movement in the sense that a premature breakout can close outside of a predrawn boundary line and even spend several days in breakout mode. Prices then return back to the geometric pattern. However, the initial breakout was only a harbinger of things to come, and within a few weeks a genuine breakout occurs. I call these subsequent breakouts secondary breakouts or pattern recompletions.” – Ch 3, page 38, Identifying the trades and the trading vocabulary
“Unlike the premature breakout, which is followed by a genuine breakout in the same direction, the false breakout results in prices either developing a much larger pattern or strongly moving in the opposite direction. Some traders refer to false breakouts to the downside as a bear trap and false upside breakouts as a bull trap. This means that traders who normally position themselves in the direction of the initial price thrust get stuck on the wrong side of the market.” – Ch 3, page 40, Identifying the trades and the trading vocabulary
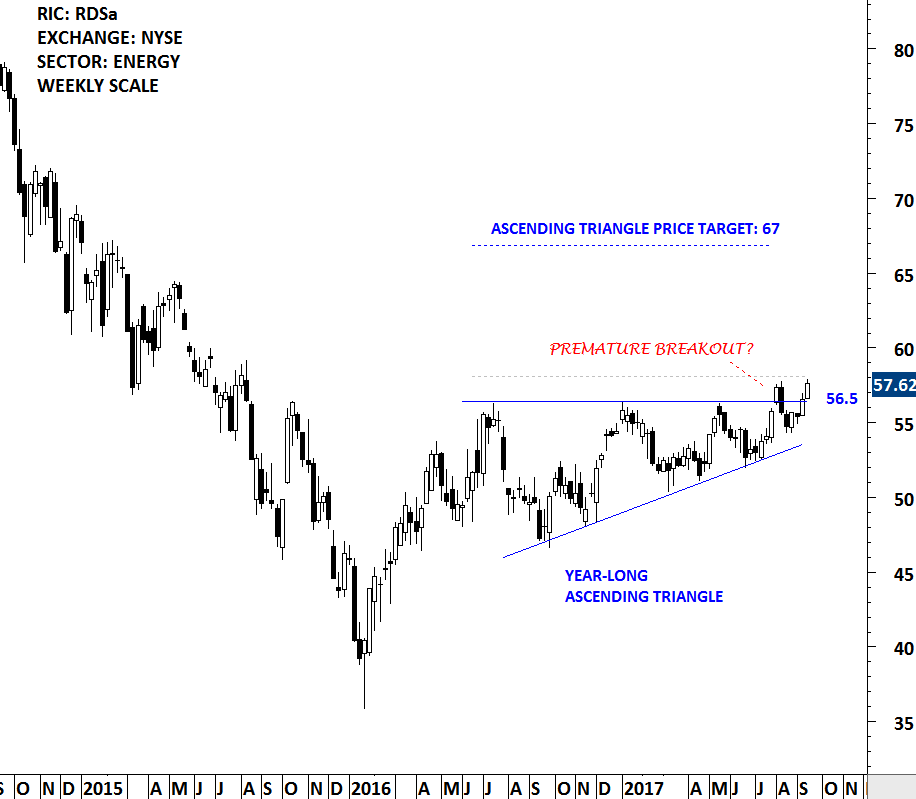
In the first week of August, price of Royal Dutch Shell breached the upper boundary of a year long ascending triangle at 56.5 levels. In the following week, it reversed back into the chart pattern. After spending few weeks inside the chart pattern boundaries, the stock gained momentum and is now challenging for the second time the upper boundary of the bullish continuation chart pattern. A confirmed (secondary breakout) can complete the bullish continuation chart pattern with a possible price target of 67 levels. Royal Dutch Shell might be a good example to apply the concept of premature breakout to chart patterns.
Tech Charts Membership

By becoming a Premium Member, you’ll be able to improve your knowledge of the principles of classical charting.
With this knowledge, you can merge them with your investing system. In fact, some investors use my analyses to modify their existing style to invest more efficiently and successfully.

As a Premium Member of Aksel Kibar’s Tech Charts,
You will receive:
-
Global Equities Report. Delivered weekly.
-
Classical charting principles. Learn patterns and setups.
-
Actionable information. Worldwide indices and stocks of interest.
-
Risk management advice. The important trading points of each chart.
-
Information on breakout opportunities. Identify the ones you want to take action on.
-
Video tutorials. How patterns form and why they succeed or fail.
-
Watch list alerts. As they become available so you can act quickly.
-
Breakout alerts. Usually once a week.
-
Access to everything (now and as it becomes available)o Reports
o Videos and video series -
Multi-part webinar course. You learn the 8 most common charting principles.
-
Webinars. Actionable and timely advice on breaking out chart patterns.
For your convenience your membership auto renews each year.


