INTERIM UPDATE – October 12, 2017

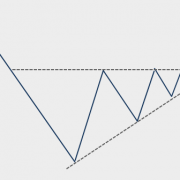
During a steady uptrend, pullbacks to long-term averages and to long-term trend line supports are usually good places to add to existing or enter new long positions. These pullbacks are usually a breath-taking period or a pause during the uptrend. As the pullback develops, it can either take the form of a top reversal formation or a continuation. A continuation chart pattern usually indicates the resumption of the uptrend.

There are two important chart developments on Alphabet Inc. and Johnson & Johnson that are worth mentioning. Both stocks have been in a steady uptrend. They are rising above their well-defined multi-year upward trend lines. Over the past 4 months, both equities formed a short-term sideways consolidation that can be identified as a rectangle. Given the direction of the previous trend, these rectangles can act as bullish continuation chart patterns.

Read more

SPAIN IBEX 35 INDEX

Every week Tech Charts Global Equity Markets report features some of the well-defined, mature classical chart patterns under a lengthy watchlist and the chart pattern breakout signals that took place during that week. Global Equity Markets report covers single stocks from developed and emerging markets, ETF’s and global equity indices. The report starts with a review section that highlights the important chart developments on global equity benchmarks. This blog post features one of several great chart analysis that were highlighted in the review section from the latest Global Equity Markets report.

It has been a volatile week for Spanish politics and the country’s financial assets. Spain’s IBEX 35 index has been trending lower since May 2017. The downtrend in the short-term formed a well-defined trend channel. During last week’s sell-off, the index rebounded from the lower boundary of the trend channel. There is no classical chart pattern that would suggest that index is finding a bottom or another chart pattern development that would signal further downside. However, two interesting candlestick patterns drew my attention which I find worth mentioning.

Read more

GLOBAL EQUITY MARKETS – October 7, 2017

REVIEW


It has been a volatile week for Spanish politics and the country’s financial assets. Spain’s IBEX 35 index has been trending lower since May 2017. The downtrend in the short-term formed a well-defined trend channel. With this week’s sell-off, the index rebounded from the lower boundary of the trend channel. There is no classical chart pattern that would suggest that index is finding a bottom or another chart pattern development that would signal further downside. However, two interesting candlestick patterns drew my attention which I find worth mentioning.

At inflection points, markets give clues about the internal dynamics of the price action. These are better identified on candlestick charts. The weekly chart of the IBEX 35 index formed a hammer. This bullish reversal candlestick pattern becomes more important if it forms at important support areas. We can see 3 important technical levels overlapping at 10,000 levels. These are; the lower boundary of the 5 month-long downward sloping trend channel, the 200 day (40 week) moving average and the year-long upward trend line.


Hammer is a bullish reversal pattern that forms after a decline. In addition to a potential trend reversal, hammers can mark bottoms or support levels. After a decline, hammers signal a bullish revival. The low of the long lower shadow implies that sellers drove prices lower during the session. However, the strong finish indicates that buyers regained their footing to end the session on a strong note. While this may seem enough to act on, hammers require further bullish confirmation. Confirmation could come from a gap up or long white candlestick.


Read more

VOLUME AS A CONFIRMING INDICATOR

Volume is an important indicator that can be used to confirm certain price movement. It is always positive to see increasing volume when a stock is advancing. An advance on expanding volume is deemed more robust than an advance on contracting volume. Likewise, it is good to see an increase in volume during a breakout from a lengthy consolidation range.

Another way to use volume indicator is to confirm price action at market tops and bottoms. After a sharp sell-off, a spike in volume is usually considered a selling climax and suggests a possible bottom. If consecutive attempts to reach new highs are accompanied by lower volume it is usually considered a non-confirmation and forecasts a possible trend reversal.

Read more

GLOBAL EQUITY MARKETS – September 30, 2017

REVIEW


Uptrend remains intact for the emerging markets index. MSCI Emerging Markets Index cleared decade-long trend resistance at 1,015 levels and continues to trend higher. Strong support remains between 1,000 and 1,015 levels. Last one week’s pull back is possibly finding support at the lower boundary of the year-long upward trend channel. Weekly candlestick pattern (hammer) on iShares MSCI Emerging Markets Index ETF (EEM) is featured in the following chart. Hammer candlestick pattern at support area can signal a bullish reversal.

Read more

Factor LLC and Tech Charts Member Webinar – September 2017

Member Webinar and Q&A with Peter L. Brandt and Aksel Kibar – Recorded live September 21, 2017

Opening discussion/presentation by Peter and Aksel 

  • Favorite classical chart patterns
  • Establishing timing of entry and targets
  • Current markets

Live questions from Members  

  1. Peter: Do you track prices of rice separately or is it included in the grains chart that you already are tracking? 46:02
  2. Aksel: How important is the volume when price break out from the chart pattern? Is it more reliable with higher volume in your opinion? 47:01
  3. Either: CS – (as an example) You pull up a chart on interactive brokers, big charts, metastock, etc., and you get different break out resistance lines — what is the “official” chart? 48:23
  4. Peter: Since I traded more in India, can you please tell what is the strongest sector that can be played for nifty move up to 11250? 50:54
  5. Aksel: What risk management / trade management rules of thumbs do you apply when trading? 51:41
  6. Both: From observing your trades/recommendations you seem to have a different time frame for your ideal trade setups (10-26 weeks vs 4-24 months) — would be curious to understand if this is a function of the different markets you trade or if you just have different experiences with the reliability of time frames or something else? 52:51
  7. Both: Neither of you use volume in your analysis, to confirm breakouts , etc., can you talk a little bit about why you don’t use it, especially for stocks Aksel as volume is more readily available there compared to forex. 54:54
  8. Peter: Can the right shoulder in gold chart morph into an abbreviated one and thus making it breakout powerfully?  What is the reason for you to have the H&S to be symmetrical in case of gold? 58:13
  9. Aksel: I have a general question concerning the neckline of HS-Formation. I noticed the neckline/boundary can be horizontal, and diagonal as well. Is that of any significance? 1:00:12
  10. Either: With regard to futures the successful patterns are 12-16 weeks long. In light of having to wait for the “right” patterns as a trader are you not significantly limiting yourself in building significant equity due to the few opportunities that emerges. 1:00:52
  11. Either: What do you see as the pros and cons of using CFDs for trading stocks? And is it an instrument your recommend using? 1:02:42
  12. Either: If a flag/pennant correction after a previous move, where you ideally enter and set the stop loss? 1:04:10
  13. Peter: You mentioned the tactical challenges in trading 1-2 year patterns — would you mind explain how you address these challenges tactically? 1:06:10
  14. Aksel: Do you agree with Peter that profits should be taken when target is met? 1:08:03
  15. Either: Do either of you have a real preference for bars over candles and why? 1:09:29
  16. Peter: Do you also watch bar-by-bar in order to identify patterns more accurately. Kind of “tape reading”? I understand you trade the break out, but are you more alert when e.g. bars are more narrow ranged at the moment you think breakout comes? 1:10:25
  17. Either: Where do you place initial and subsequent stops on BO? What do you consider too late a BO entry? 1:11:18
  18. Either: There are so many great trade set up ideas provided for in your chart analysis.  Practically when managing capital, you are constrained by the number of trades that you can take. How do you manage the process of selecting the “best trades” and what criteria do you use to define those? 1:14:06


Read more

U.S. DOLLAR INDEX ETF (UUP)

While still at the early stages, an important chart development might be taking place on the U.S. Dollar Index. In the second half of 2016, the U.S. dollar index breached the upper boundary of its consolidation range at 100.3 levels. The breakout was a bull trap (false breakout) and after couple of weeks, the price reversed back into the trading range and traveled sharply towards the lower boundary of the rectangle. In the beginning of September 2017, the price breached the chart pattern boundary on the downside. Those who are looking for a possible reversal of the downtrend on the U.S. dollar, should keep an eye on the 93 levels on the U.S. Dollar Index Futures chart and 24.15 levels on the US Dollar ETF (UUP) chart. A reversal above the mentioned levels can result in a bear trap (false breakdown) and turn out to be positive for the U.S. dollar in the coming months.

Read more

Symmetrical Triangle – Bullish Reversal

You don’t have access to view this content

GLOBAL EQUITY MARKETS – September 23, 2017

REVIEW


Another Emerging Asia equity index broke out to new all-time highs. Philippines SE Composite index breached the 8,125 level after moving in a 2 year-long, wide trading range between 6,500 and 8,125 levels. The equity benchmark has been in a steady uptrend for the past year. Last two week’s price action cleared the strong horizontal resistance and pushed the index to uncharted territory. Once a strong resistance, 8,125 level now acts as support. As long as the index holds above that level we will expect positive momentum to continue in the Philippine Stock Exchange. An efficient way to take advantage of the recent bullish technical development in the Emerging Asian country is through iShares MSCI Philippines ETF (EPHE.K) that is listed on the New York Stock Exchange. The chart below reviews the iShares MSCI Philippines ETF.

Read more