GLOBAL EQUITY MARKETS – August 5, 2017

REVIEW


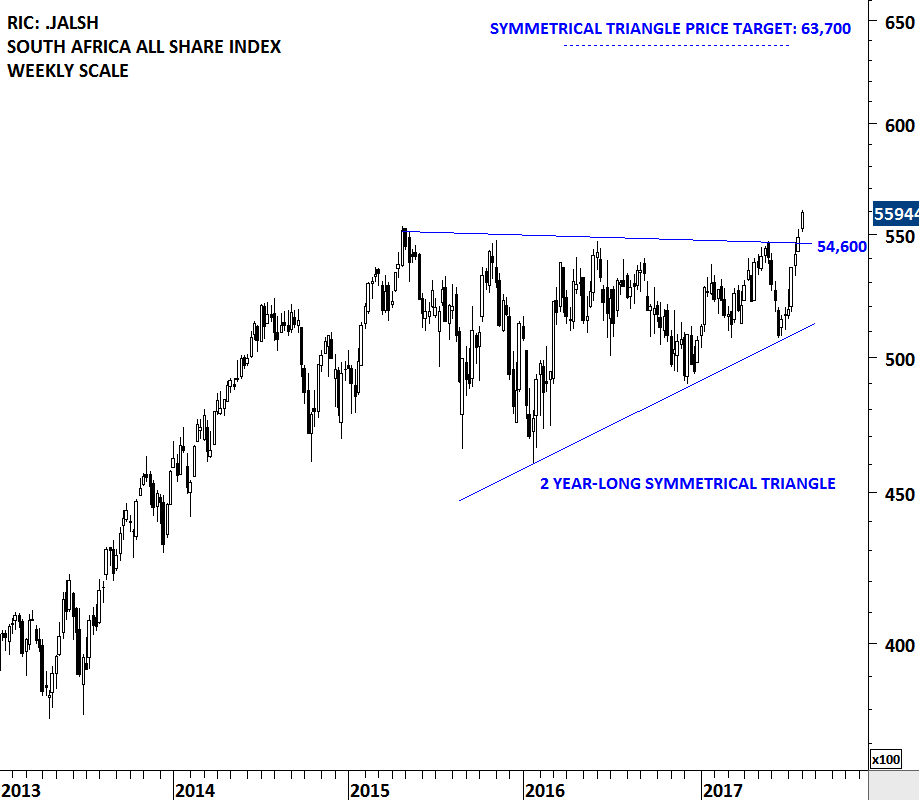
South Africa equities are possibly entering into a strong uptrend with the completion of a 2 year-long sideways consolidation. This week’s price action breached the multi-year trend resistance on the South Africa All Share index and pushed the local equity benchmark to all-time highs. Breakouts from multi-year consolidations usually result in multi-month trends. 54,600 levels will remain as strong support. Possible chart pattern price target for the South Africa All Share Index stands at 63,700 levels.

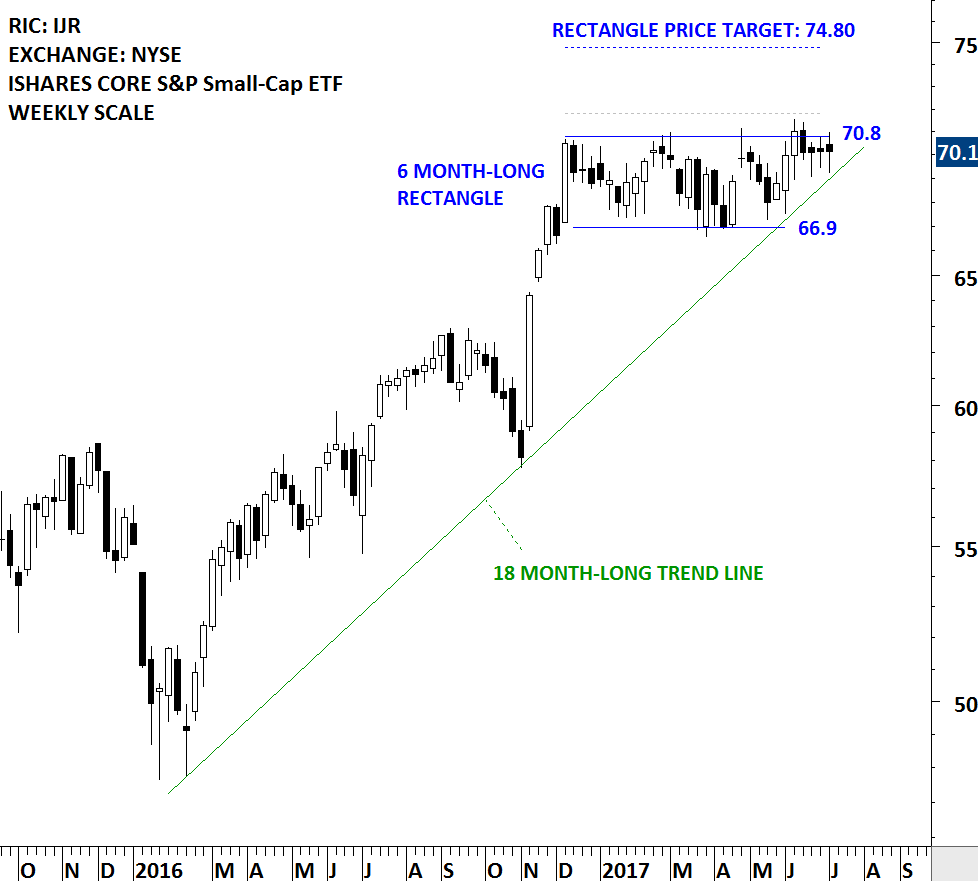
There are several tradable ETFs listed on the local exchange and also on the global exchanges. Below is a chart of South Africa listed ETF.

Read more

ROYAL DUTCH SHELL

Every week Tech Charts Global Equity Markets report features some of the well-defined, mature classical chart patterns under a lengthy watchlist and the chart pattern breakout signals that took place during that week. Global Equity Markets report covers single stocks from developed and emerging markets, ETF’s and global equity indices. The main focus of the weekly report is to bring member’s attention some of the best examples of classical charting. Chart patterns that are likely to resolve in a directional move. This blog post highlights one of several great chart setups from the latest Global Equity Markets report.

ROYAL DUTCH SHELL PLC (RDSa)

The Royal Dutch Shell plc explores for crude oil and natural gas around the world, both in conventional fields and from sources, such as tight rock, shale and coal formations. The stock is listed in European exchanges as well as the New York Stock Exchange. The chart below shows the New York Stock Exchange listing. Price chart formed a year-long ascending triangle with the strong horizontal resistance standing at 56.5 levels. The stock once again reversed from the lower boundary of its chart pattern. A daily close above 58 levels will confirm the breakout from the year-long ascending triangle with a possible price target of 67 levels.

Read more

GLOBAL EQUITY MARKETS – July 29, 2017

REVIEW


Swiss Market Index is possibly preparing for a breakout from its 2 month-long sideways consolidation. Last 2 month’s price action can be identified as a symmetrical triangle and it can act as a bullish continuation. The upper boundary of the triangle stands as resistance at 9,080 levels. Symmetrical triangle possible chart pattern price target stands at 9,500 levels. Swiss benchmark equity index performed better than its European peers. This week’s report features three different bullish chart developments on the Swiss financial stocks. Swiss Market Index ETF is available in local (CHF) currency via iShares SMI ETF that is listed on the Swiss Exchange. Also, a USD denominated ETF is listed on the New York Stock Exchange via iShares MSCI Switzerland Capped ETF (EWL).

Read more

TURKCELL (TKC) – TURKEY

Every week Tech Charts Global Equity Markets report features some of the well-defined, mature classical chart patterns under a lengthy watchlist and the chart pattern breakout signals that took place during that week. Global Equity Markets report covers single stocks from developed and emerging markets, ETF’s and global equity indices. The main focus of the weekly report is to bring member’s attention some of the best examples of classical charting. Chart patterns that are likely to resolve in a directional move. This blog post highlights one of several great chart setups from the latest Global Equity Markets report. Below you will also find a sample educational video on rectangle chart pattern as well as past examples of Tech Charts Breakout Alerts on Rectangles.

TURKCELL ILETISIM HIZMETLERI (TKC)

Turkcell Iletisim Hizmetleri AS is engaged in establishing and operating a Global System for Mobile Communications (GSM) network in Turkey and regional states. The stock is listed on the New York Stock Exchange via depository receipts. Price chart formed a 4 month-long rectangle with the horizontal boundary standing as resistance at 8.75 levels. A daily close above 9 levels will confirm the breakout from the bullish continuation chart pattern with a possible price target of 9.65 levels. Rectangle can act as a bullish continuation chart pattern.

Read more

GLOBAL EQUITY MARKETS – July 22, 2017

REVIEW


U.S. Biotech stocks resume uptrend after their strong breakout in the last week of June. June 17, 2017 and June 24, 2017 Global Equity Markets reports drew attention to the strength in the Biotech ETFs and alerted members on the multi-month bullish chart pattern completions. Both SPDR S&P BIOTECH ETF and ISHARES NASDAQ BIOTECH ETF had strong breakouts. After few weeks of pull back to the previously broken chart pattern boundary, NASDAQ BIOTECH INDEX resumed its uptrend. Read more

iShares MSCI UAE Capped ETF

The Fund seeks to track the investment results of the MSCI All UAE Capped Index, which is designed to measure the equity market performance in the United Arab Emirates. The Fund generally invests at least 80% of its assets in securities of the underlying index or in depository receipts representing securities of the underlying index. The ETF is listed on the Nasdaq Stock Exchange. Price chart possibly formed a 15 month-long H&S continuation or a rectangle with the strong horizontal boundary standing at 17.75 levels. Last 6 month’s price action can also be identified as a rectangle; another short-term consolidation, usually acting as a preparation for a breakout. A daily close above 18.10 levels will confirm the breakout from the multi-month trading range with the chart pattern price target of 20 levels. Top 10 holdings of the iShares MSCI UAE Capped ETF is compiled in a table below. Also you can find below some examples of H&S continuation chart patterns that Tech Charts Global Equity Markets reports featured in the past issues.

Read more

GLOBAL EQUITY MARKETS – July 15, 2017

REVIEW


Global equities had a strong performance led by Emerging Market equities and mainly Chinese Large-caps. MSCI Emerging Markets Index breached its decade-long trend line resistance at 1,020 levels. Tech Charts Global Equity Markets reports drew attention to the developing strength in Emerging Asia equities. Following the strong performance of S.Korea, Taiwan, India and Philippines, Chinese equities are also joining the list. An interim update was sent out during the week discussing the strong breakout on the Ishares China Large Cap ETF (FXI). Below charts feature the MSCI Emerging Markets Index (Price index in USD) and the New York Stock Exchange listed iShares MSCI Emerging Markets ETF (EEM).

Read more

INTERIM UPDATE – July 13, 2017

ISHARES CHINA LARGE CAP ETF (FXI)

A major chart pattern development is taking place on the Chinese equity ETF that is listed on the New York Stock Exchange. Ishares China Large Cap ETF is possibly completing a major 20 month-long base formation. Multi-month H&S bottom chart pattern has a neckline at 39.65 levels. Breakout attempt in the first quarter of 2017, was followed by a short-term set-back that found support at the neckline. However, during this week we can see that the China Large Cap ETF gained momentum once again. Read more

EUROSTOXX 50 INDEX & EMERGING MARKETS

There is enough technical evidence that emerging markets found strong resistance around the current levels. The MSCI EM USD price index tested its decade-long trend line and also the upper boundary of its year-long trend channel. However, it is still early to call for a possible reversal from the strong resistance area. MSCI EM index is possibly forming a decade-long symmetrical triangle.

Read more

GLOBAL EQUITY MARKETS – July 8, 2017

REVIEW


It has been more than six months that the U.S. small caps are trading in a tight range. One of the well-defined chart patterns the weekly global equity markets report frequently discussed was the ISHARES CORE S&P Small-Cap ETF. IJR has a well-defined trading range between 66.9 and 70.8 levels. The ETFs price is holding above the 18 month-long upward trend line. A directional move should follow soon. The margin between the multi-month trend line and the upper boundary of the 6 month-long rectangle has narrowed. A daily close above 71.80 will confirm the breakout from the 5 month-long rectangle and suggest higher prices. A breach below the 18 month-long trend line can put pressure on the small caps and push prices towards the lower boundary of the rectangle at 66.9 levels.

Read more