GLOBAL EQUITY MARKETS – June 17, 2017

Announcements:

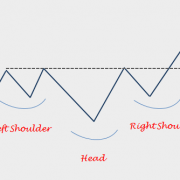
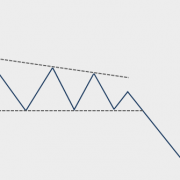
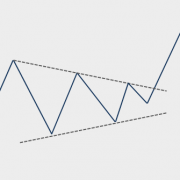
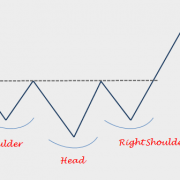
1) New educational videos explaining the most analyzed 8 classical chart patterns are uploaded under the Educational Videos page. More videos are being prepared, featuring different outcomes for these chart patterns.

2) A new page featuring all the breakout alerts will be made available (next few days) for members. It will be a helpful tool for following up on the latest chart patterns, sort latest breakout alerts by date and search by ticker.

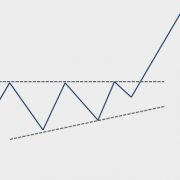
3) Due to high volume of requests from Tech Charts members, starting from this update I will add reference levels that would possibly negate a chart pattern. Other important labeling will be included on the charts. Below info graphic can be useful to explain the new additions on the charts.

Read more

INTERIM UPDATE – June 16, 2017

An interim update on some of the financial stocks might be valuable before the trading week ends. Over the past few weeks Tech Charts Global Equity Markets report drew attention to possible breakouts on Bank NY Mellon and Hartford Financial. Both stocks had strong breakouts from their multi-month long consolidation ranges and they are resuming their uptrends.

Read more

Descending Triangle – Bearish Continuation

You don’t have access to view this content

GLOBAL EQUITY MARKETS – June 10, 2017

UK election results, FANG (Facebook, Amazon, Netflix & Google) Volatility and U.S. Financial/Banking stocks strength. As much as I followed, these were the market moving topics of the week. It is important to note that U.K. FTSE 100 index broke out to all-time highs from its multi-decade long consolidation and the outlook remains positive in the long-term. Please see June 3, 2017 report for U.K. FTSE 100 Index chart.

Political/geopolitical events should not affect our chart interpretation. In fact, I believe that price action is primary and events are secondary. Price is a leading indicator. I am sure many of you experienced a breakout followed by a major news or event.

Read more

LONG-TERM CHARTS & LAUNCHING PATTERNS

Stock prices are either in a follow through trending phase or in a consolidation phase. During a strong trending period, a stock will proceed from one price level to another with very little interruption. During a consolidation period a stock will move in both directions without producing any meaningful or sustained price change.

During periods of consolidation prices tend to form a recognizable chart pattern which helps us to determine the direction and magnitude of the next substantial trend with some degree of accuracy.

Because price action and chart patterns are a result of human interaction, it is possible to find those repeating chart patterns in different markets, in different time frames such as on daily, weekly and monthly scale and in different time periods.

Read more

GLOBAL EQUITY MARKETS – June 3, 2017

This week’s Global Equity Markets report covers several ETFs and global equity indices and single stocks from Developed and Emerging countries. You will find that some of the themes are longer-term and can offer great opportunity once these chart patterns are resolved on the upside. The info-graphic below explains what each label on the charts and section headers stand for. I hope this will make it easier to navigate through the charts.

Read more

Ascending Triangle – Bullish Continuation

You don’t have access to view this content