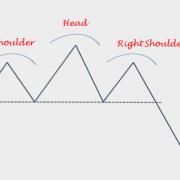
Head and Shoulders Top – Bearish Reversal
You don’t have access to view this content
You don’t have access to view this content

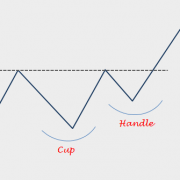
Every week, as I go through 1000’s of charts. I look for select, common characteristics on developing chart patterns. And the chart pattern should be mature on a weekly scale. For me, this means chart patterns in duration between 3 to 24 months. It should have a well-defined and preferably a horizontal chart pattern boundary. I look for chart patterns classified as H&S top/bottom, rectangles, cup & handle continuations, double top/bottoms and flags. I only feature symmetrical triangles that have well-defined boundaries. The boundary of the chart pattern should be tested several times before the breakout takes place. Several tests of a chart pattern boundary is an indication that market participants actually recognized the pattern boundary as an important technical level. A breach of this level would signal a shift in the market dynamics between the bulls and the bears.

You don’t have access to view this content
Dear Tech Charts members,
Thank you for joining Tech Charts as Founding Member. I hope to identify many great chart set-ups, trading & investment themes and add value to your decision making process in the years ahead. This week’s Global Equity Markets report covers several ETFs from different regions, single stocks from Developed and Emerging countries and equity indices. You will find that some of the themes are longer-term and can offer great opportunity once these chart patterns are resolved on the upside. In this report I also added a section that explains what each label on the charts and section headers stand for. I hope this will make it easier to navigate through the charts.

Please watch this interview between Aksel Kibar and Peter Brandt discussing the Tech Charts Service. Your opportunity to join as a Founding Member (at discounted for life) expires on June 1st.
Aksel goes into detail about what you could expect as a Founding Member (Sign up links below video), service includes:
You don’t have access to view this content
You don’t have access to view this content
You don’t have access to view this content
Dear followers of the Tech Charts blog,
Today I am pleased and proud to announce that we have launched our long awaited, Tech Charts membership service. And because of your loyal following to date, we’re offering you the opportunity to join the service as a special Founding Member.

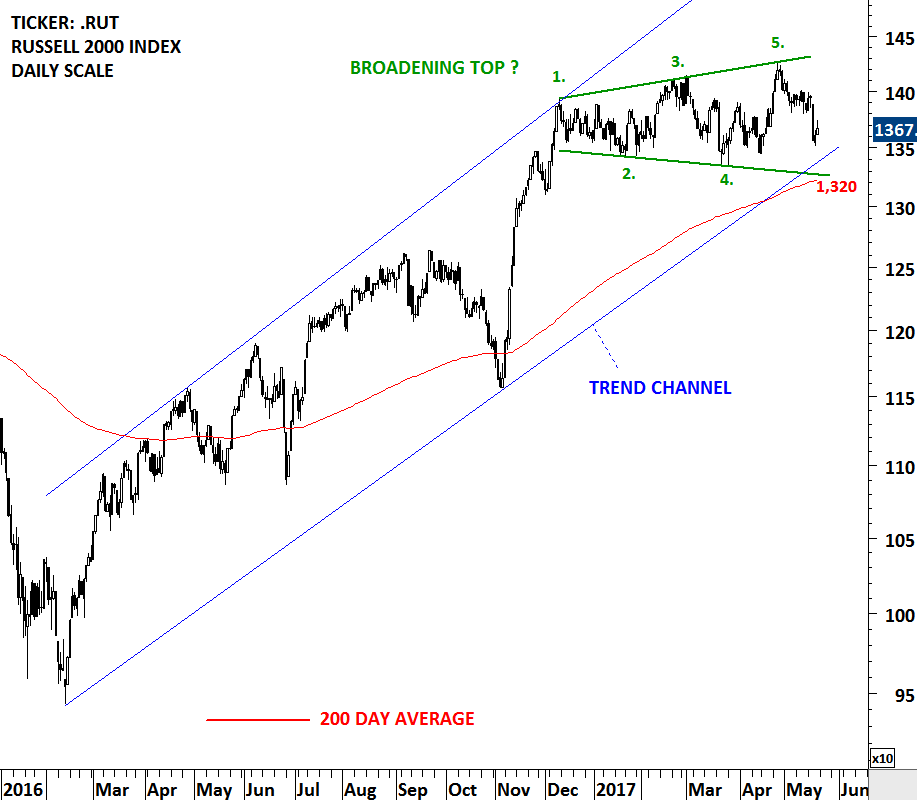
The Russell 2000 Index is the recognized benchmark measuring the performance of the small-cap segment of the U.S. equity universe. The Russell 2000 Index is a subset of the Russell 3000 Index, representing approximately 10% of the total market capitalization of that index. It includes 2000 of the smallest securities based on a combination of market cap and current index membership. The index is maintained by FTSE Russell, a subsidiary of the London Stock Exchange Group. The Russell 2000 is by far the most common benchmark for mutual funds that identify themselves as “small-cap”, while the S&P 500 index is used primarily for large capitalization stocks.
Since the beginning of 2017, the small-cap segment of the U.S. equities had a volatile price action. The swings on the Russell 2000 index possibly formed a very rare chart pattern called a Broadening Top. Richard W. Schabacker in his book Technical Analysis and Stock Market Profits explains the Broadening Top chart pattern as below: