About Tech Charts
Every week, as I go through 1000’s of charts. I look for select, common characteristics on developing chart patterns. And the chart pattern should be mature on a weekly scale. For me, this means chart patterns in duration between 3 to 24 months. It should have a well-defined and preferably a horizontal chart pattern boundary. I look for chart patterns classified as H&S top/bottom, rectangles, cup & handle continuations, double top/bottoms and flags. I only feature symmetrical triangles that have well-defined boundaries. The boundary of the chart pattern should be tested several times before the breakout takes place. Several tests of a chart pattern boundary is an indication that market participants actually recognized the pattern boundary as an important technical level. A breach of this level would signal a shift in the market dynamics between the bulls and the bears.
Many people have contacted me asking what type of chart opportunities I present. So I put together just some of the chart pattern breakouts that were highlighted on this site within the Global Equity Markets reports from July 2016 till May 2017. The first part of the post features the type of breakouts that reached their chart pattern price target. The second part features those that are still trending towards their chart pattern price target. Breakouts that took place in May 2017 and still in progress are not included in this post. Starting from May 2017, Breakout alerts and watchlist updates are available with a premium member access for Tech Charts Members.
BREAKOUTS THAT REACHED CHART PATTERN PRICE TARGET
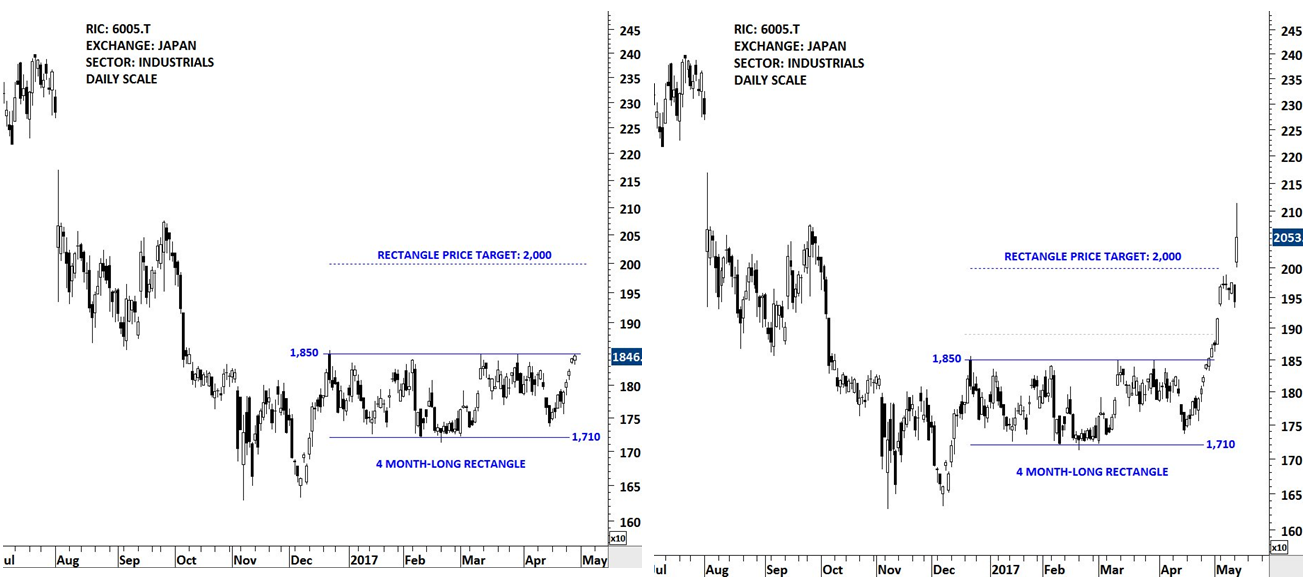
MIURA
UPDATES ON THE BREAKOUT: GLOBAL EQUITY MARKETS REPORT / TWITTER
In May 2017, MIURA completed a 4 month-long rectangle chart pattern. Daily chart showed strong gains following the breakout. Chart pattern price target was met in the following week. Breakouts from chart patterns with horizontal boundaries are usually reliable.
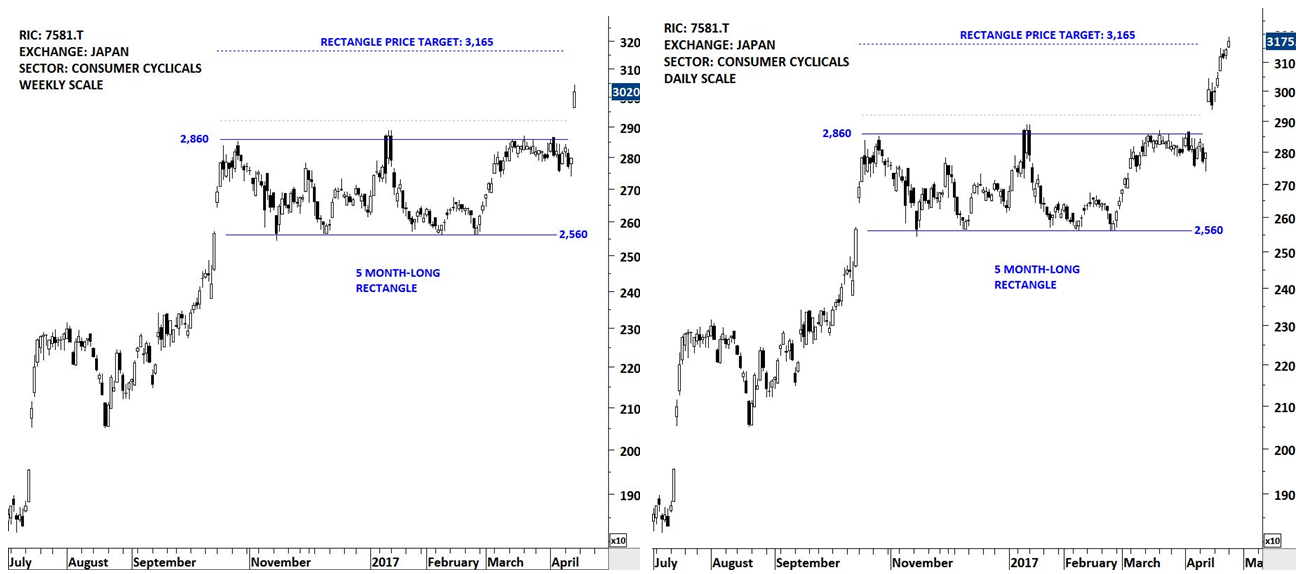
SAIZERIYA
UPDATES ON THE BREAKOUT: GLOBAL EQUITY MARKETS REPORT / TWITTER
In April 2017, SAIZERIYA completed a 5 month-long rectangle chart pattern. The daily chart shows the sharp rally following the breakout with a gap opening. In the same month, the price reached its chart pattern price target. Breakouts that take place from well-defined horizontal chart patterns are usually strong and reliable. Rectangles are classified as continuation chart patterns.
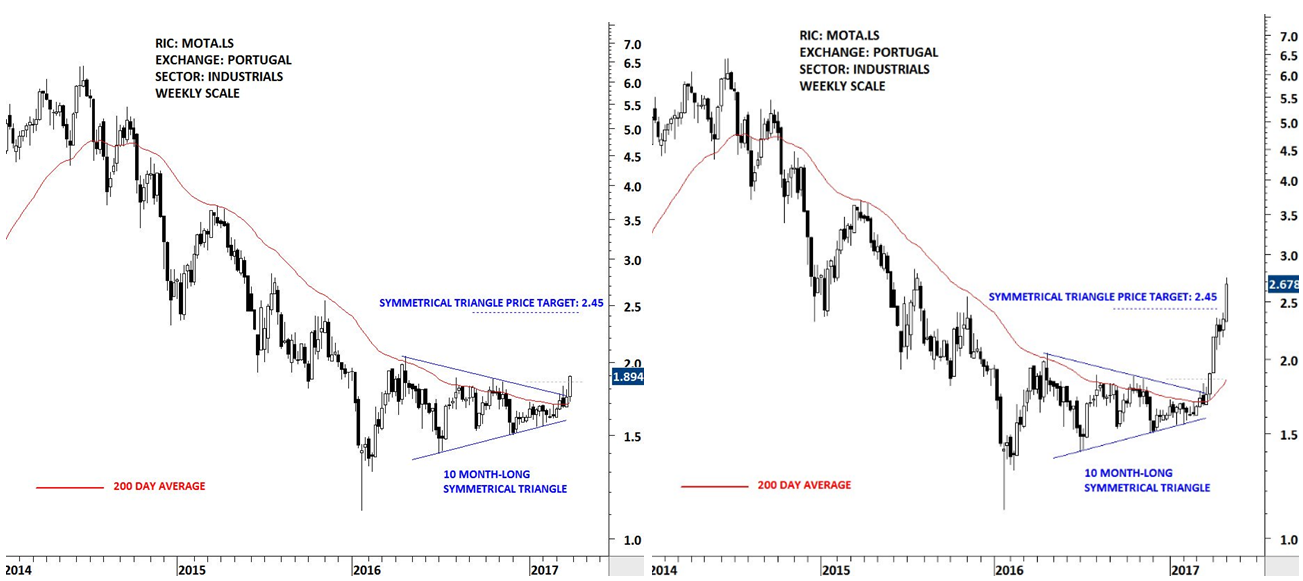
MOTA ENGIL
UPDATES ON THE BREAKOUT: GLOBAL EQUITY MARKETS REPORT / TWITTER
In April 2017, MOTA ENGIL completed a 10 month-long symmetrical triangle. While symmetrical triangles are usually continuation in nature, after long trends they can act as major reversal chart patterns. Following the breakout, it took 5 weeks for MOTA ENGIL to reach its chart pattern price target.
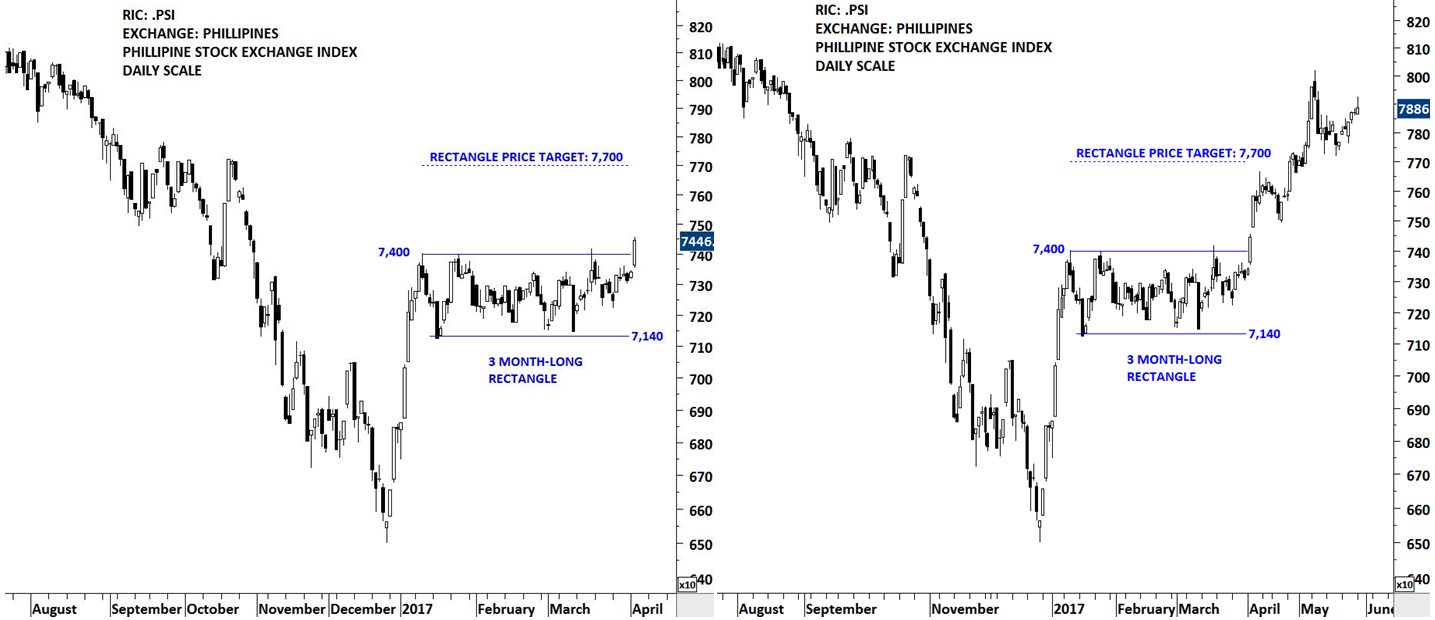
PHILIPPINES SE INDEX
UPDATES ON THE BREAKOUT: TWITTER
In April 2017, PHILIPPINES SE INDEX completed a 3 month-long rectangle continuation chart pattern. It is important for the boundaries of the rectangle to be tested several times and the chart pattern to be well-defined. Following the breakout, it took 12 days for the index to reach its chart pattern price target. Usually breakouts from tight consolidation ranges extend beyond chart pattern price target.
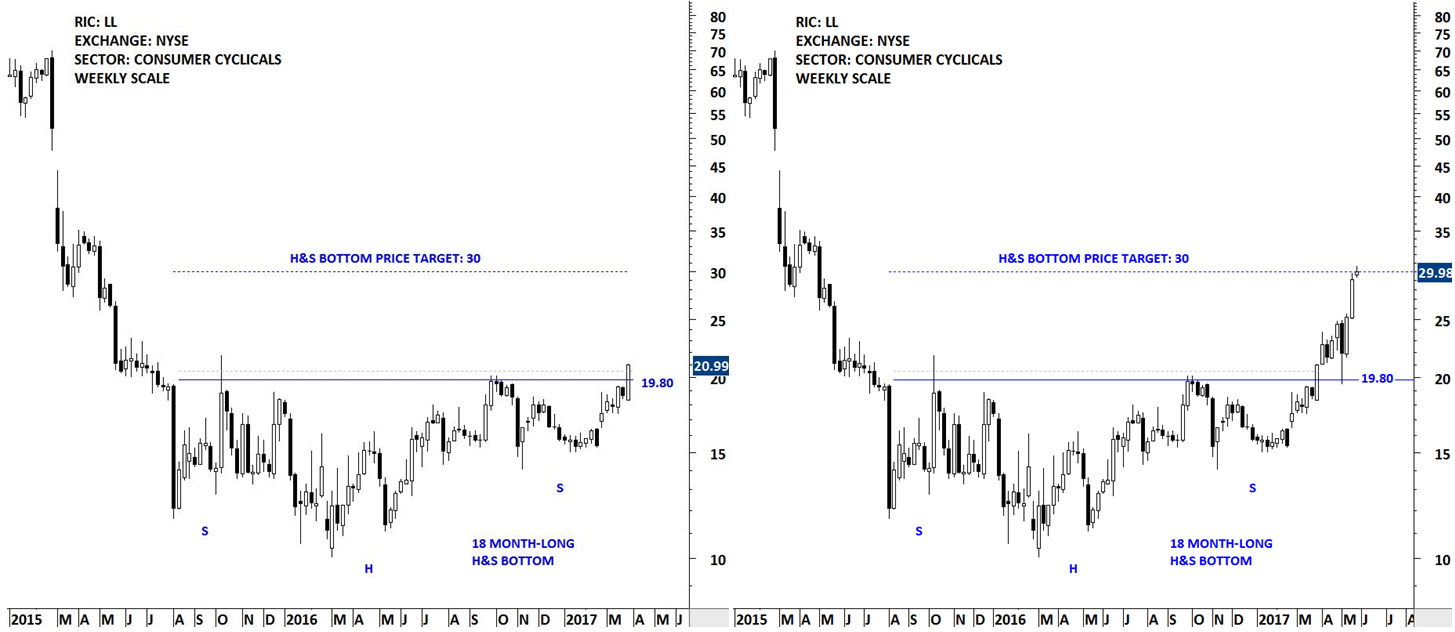
LUMBER LIQUIDATORS
UPDATES ON THE BREAKOUT: GLOBAL EQUITY MARKETS REPORT / TWITTER
In March 2017, LUMBER LIQUIDATORS completed an 18 month-long H&S bottom. H&S bottom is a bullish reversal chart pattern. The horizontal boundary was well-defined and was tested several times before the breakout took place. Following the breakout, it took 8 weeks for LUMBER LIQUIDATORS to reach its chart pattern price target.
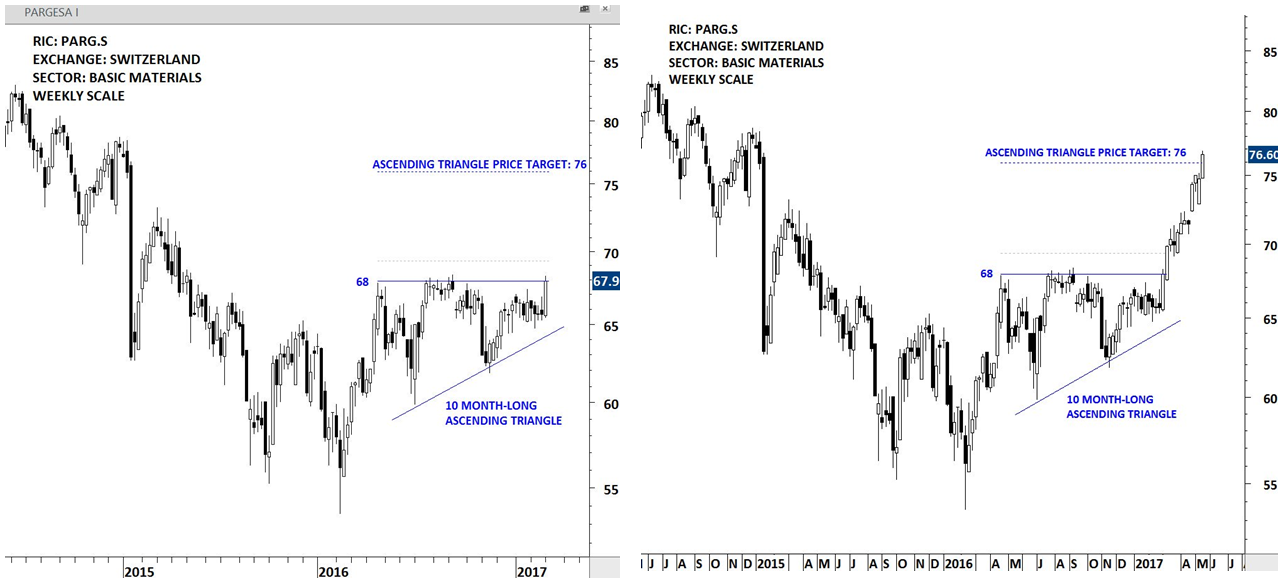
PARGESA
UPDATES ON THE BREAKOUT: GLOBAL EQUITY MARKETS REPORT / TWITTER
In March 2017, PARGESA completed a 10 month-long ascending triangle chart pattern. Ascending triangles are bullish continuation chart patterns. The horizontal boundary and higher lows gives the pattern its bullish characteristic. Following the breakout, it took 10 weeks for PARGESA to reach its chart pattern price target.
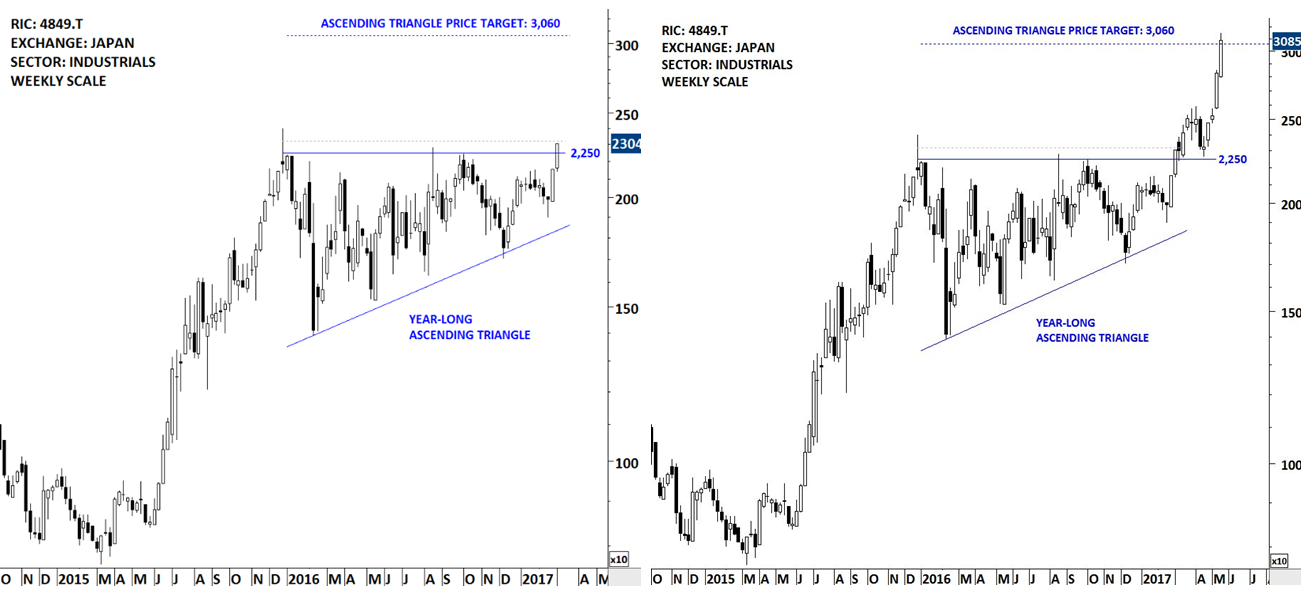
EN JAPAN
UPDATES ON THE BREAKOUT: GLOBAL EQUITY MARKETS REPORT / TWITTER
In March 2017, EN JAPAN completed a year-long ascending triangle chart pattern. Ascending triangles are bullish continuation chart patterns. The horizontal boundary and higher lows gives the pattern its bullish characteristic. It took 11 weeks for EN JAPAN to reach its chart pattern price target. Pull backs should find support at or above chart pattern boundary after confirmed breakouts. Failure to do so will put the bullish interpretation into question.
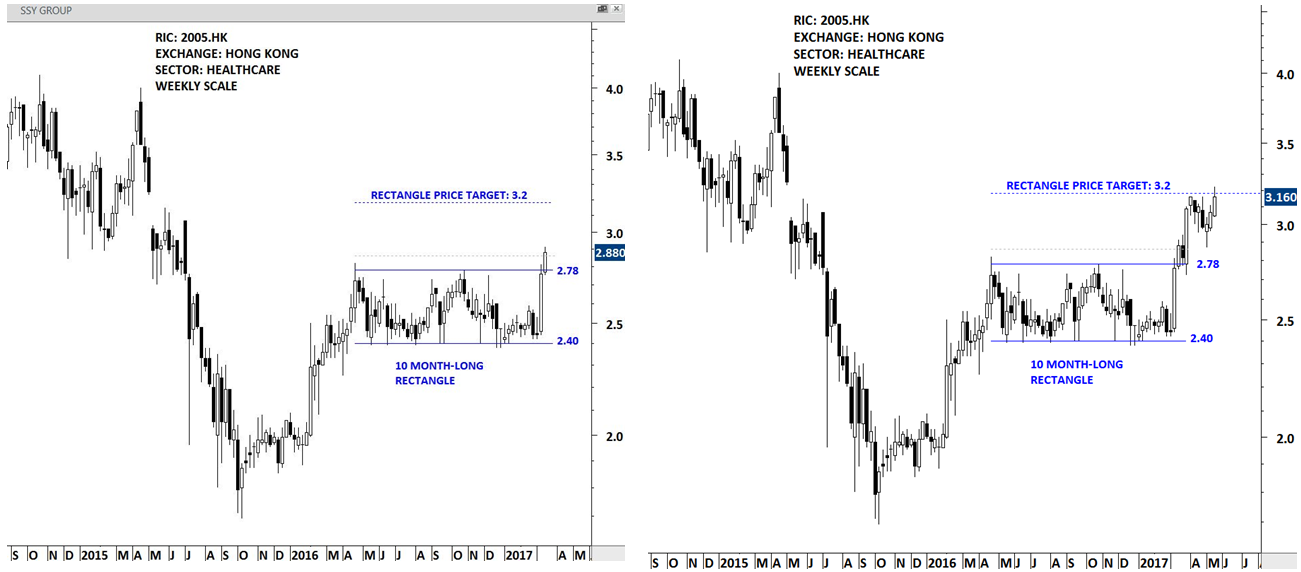
SSY GROUP
UPDATES ON THE BREAKOUT: GLOBAL EQUITY MARKETS REPORT / TWITTER
In March 2017, SSY GROUP completed a 10 month-long rectangle chart pattern. The 10 month-long rectangle acted as a continuation chart pattern. Following the breakout, it took 10 weeks for SSY GROUP to reach its chart pattern price target. Breakouts from chart patterns with horizontal boundaries are usually reliable. Several tests of the pattern boundaries increases the likelihood of a decisive breakout.
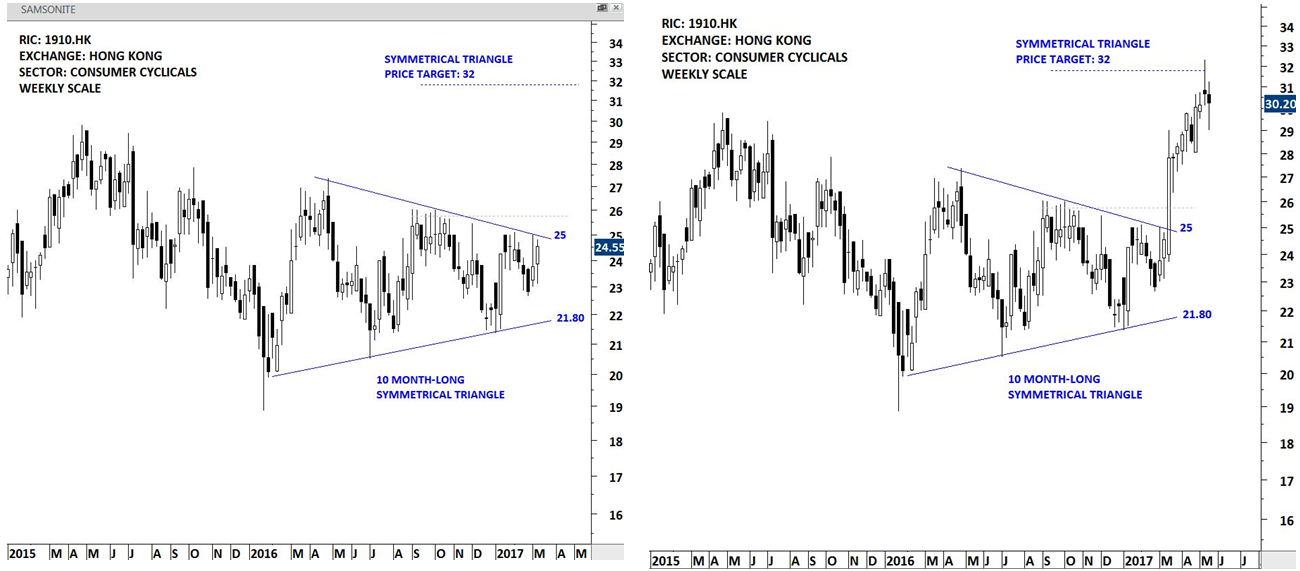
SAMSONITE
UPDATES ON THE BREAKOUT: GLOBAL EQUITY MARKETS REPORT / TWITTER
In March 2017, SAMSONITE completed a 10 month-long symmetrical triangle chart pattern. While symmetrical triangles are usually continuation in nature, after established trends they can act as major reversal chart patterns. The 10 month-long symmetrical triangle acted as a reversal chart pattern. Following the breakout, it took 8 weeks for SAMSONITE to reach its chart pattern price target. Several tests of the pattern boundary increase the likelihood of a decisive breakout.
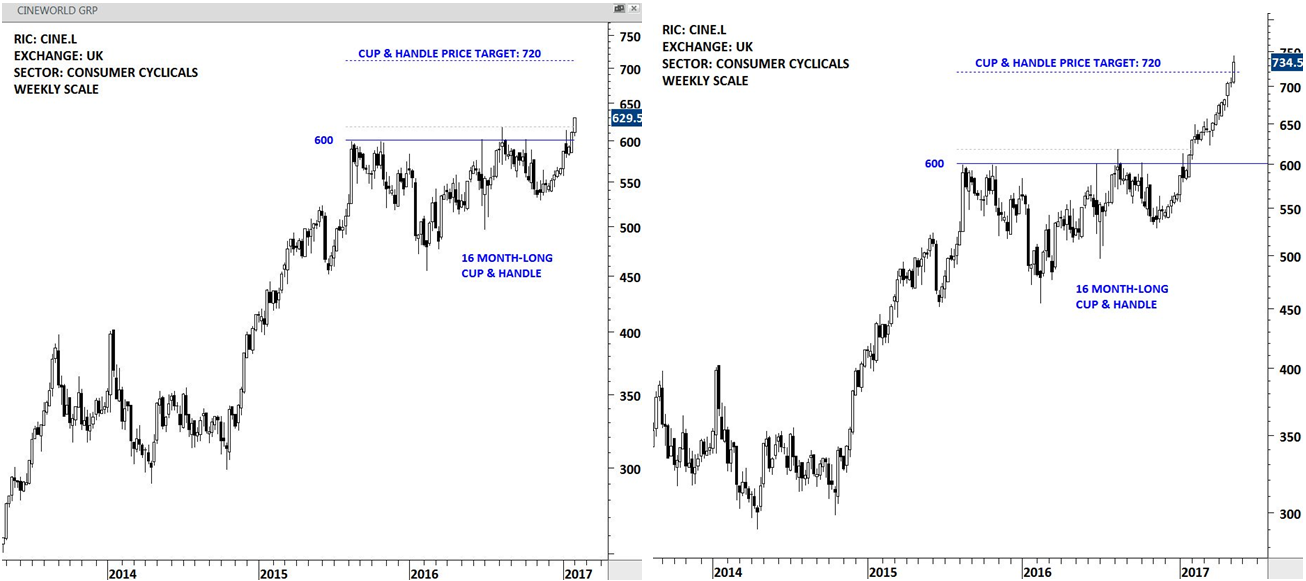
CINEWORLD
UPDATES ON THE BREAKOUT: GLOBAL EQUITY MARKETS REPORT / TWITTER
In February 2017, CINEWORLD completed a 16 month-long cup & handle chart pattern. Cup & handle is a bullish continuation chart pattern. It is another widely followed classical chart pattern with a well-defined horizontal boundary. Breakouts from cup & handle that pushes stocks to all time high levels usually offer great long-term opportunity. Following the breakout, it took 15 weeks for CINEWORLD to reach its chart pattern price target.
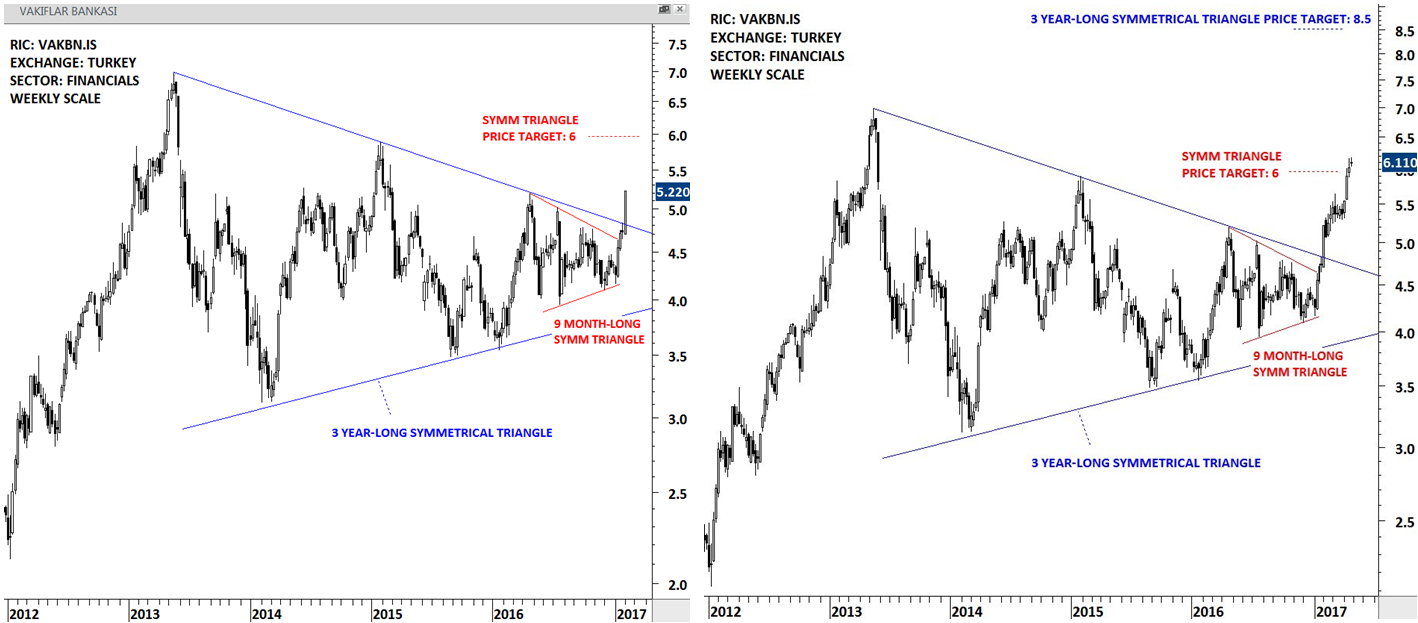
TURKIYE VAKIFLAR BANKASI
UPDATES ON THE BREAKOUT: GLOBAL EQUITY MARKETS REPORT / TWITTER
In February 2017, VAKIF BANK completed a 9 month-long symmetrical triangle chart pattern. Two symmetrical triangles in different durations were completed at the same time. The 9 month-long symmetrical triangle acted as a launching pattern. Following the breakout, it took 10 weeks for VAKIF BANK to reach its chart pattern price target.
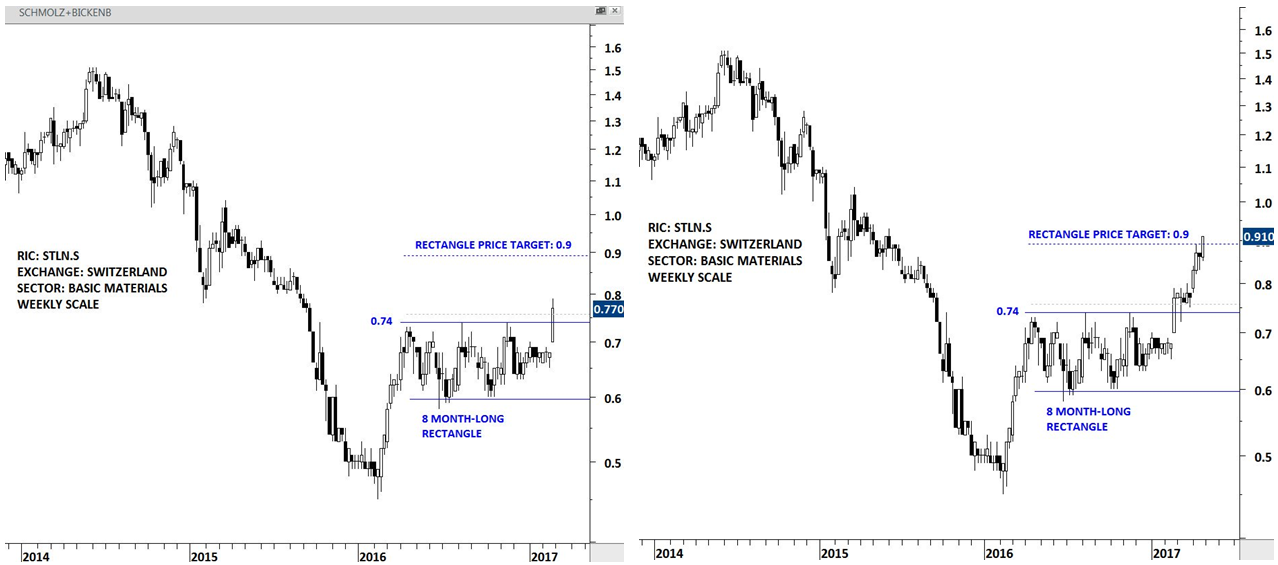
SCHMOLZ + BICKENB
UPDATES ON THE BREAKOUT: GLOBAL EQUITY MARKETS REPORT / TWITTER
In February 2017, SCHMOLZ + BICKENB completed an 8 month-long rectangle chart pattern. Following the breakout, it took 9 weeks for the stock to reach its chart pattern price target. Breakouts from chart patterns with horizontal boundaries are usually reliable. Several tests of the pattern boundary increase the likelihood of a decisive breakout.
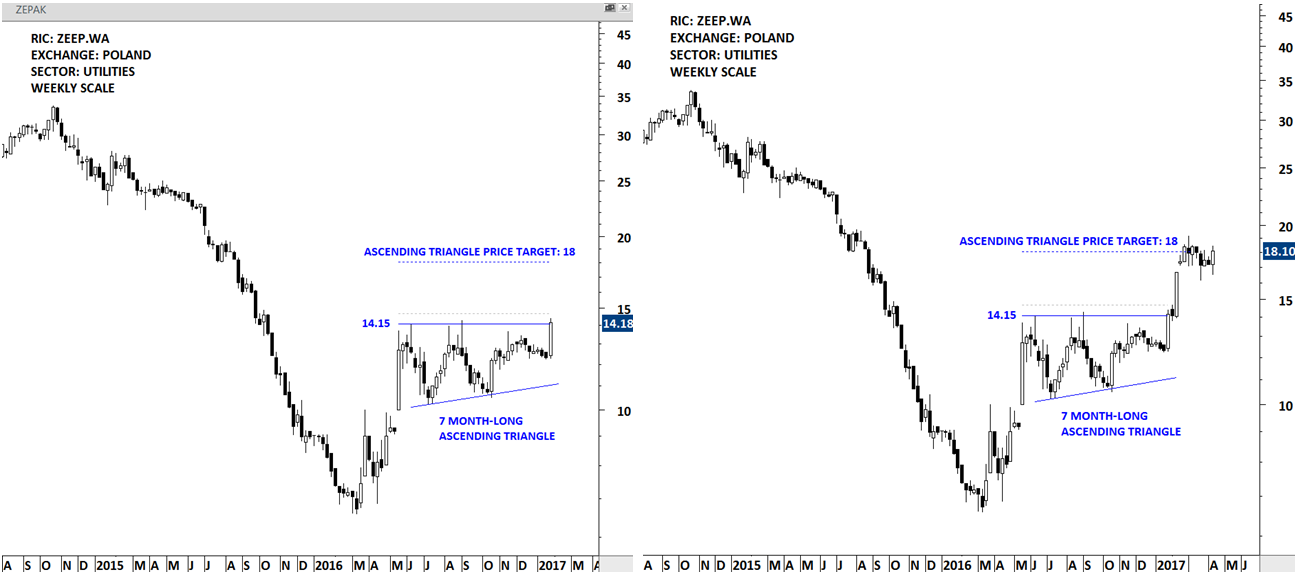
ZEPAK
UPDATES ON THE BREAKOUT: GLOBAL EQUITY MARKETS REPORT / TWITTER
In February 2017, ZEPAK completed a 7 month-long ascending triangle. Ascending triangles are bullish continuation chart patterns. The horizontal boundary and higher lows gives the pattern its bullish characteristic. Following the breakout, it took 2 weeks for ZEPAK to reach its chart pattern price target.
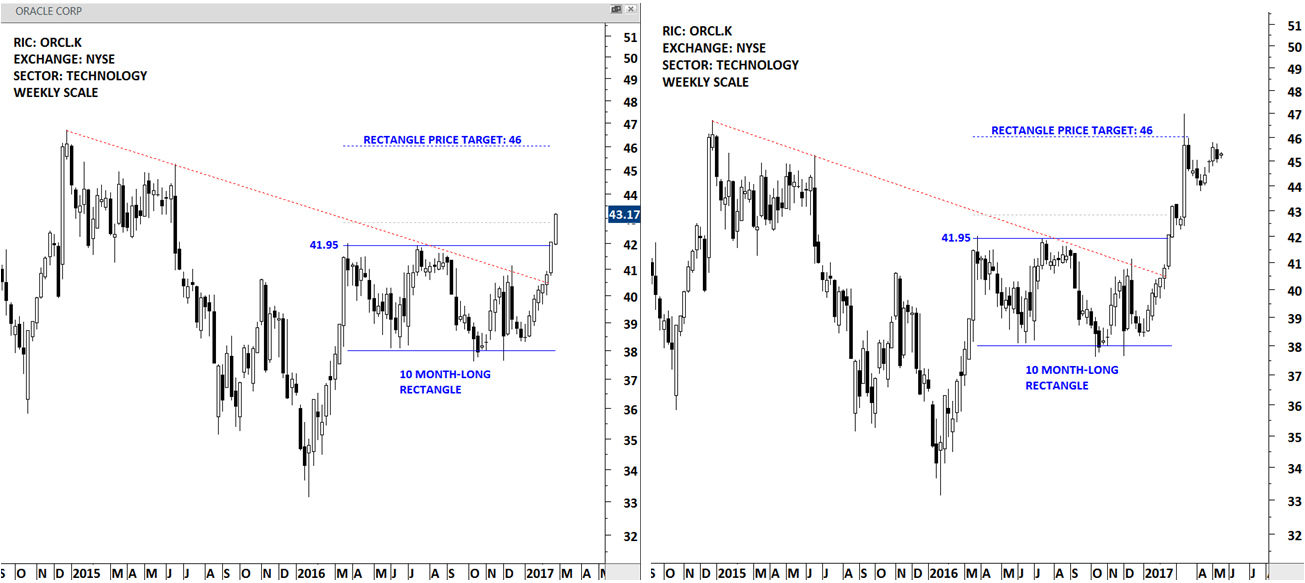
ORACLE
UPDATES ON THE BREAKOUT: GLOBAL EQUITY MARKETS REPORT / TWITTER
In February 2017, ORACLE CORP. completed a 10 month-long rectangle chart pattern. Following the breakout, it took 3 weeks for ORACLE to reach its chart pattern price target. Breakouts from chart patterns with horizontal boundaries are usually reliable. It is best when stock clears more than one important technical resistance. In this case the stock breached a 2 year-long downtrend as well as breaking out of a rectangle continuation chart pattern.
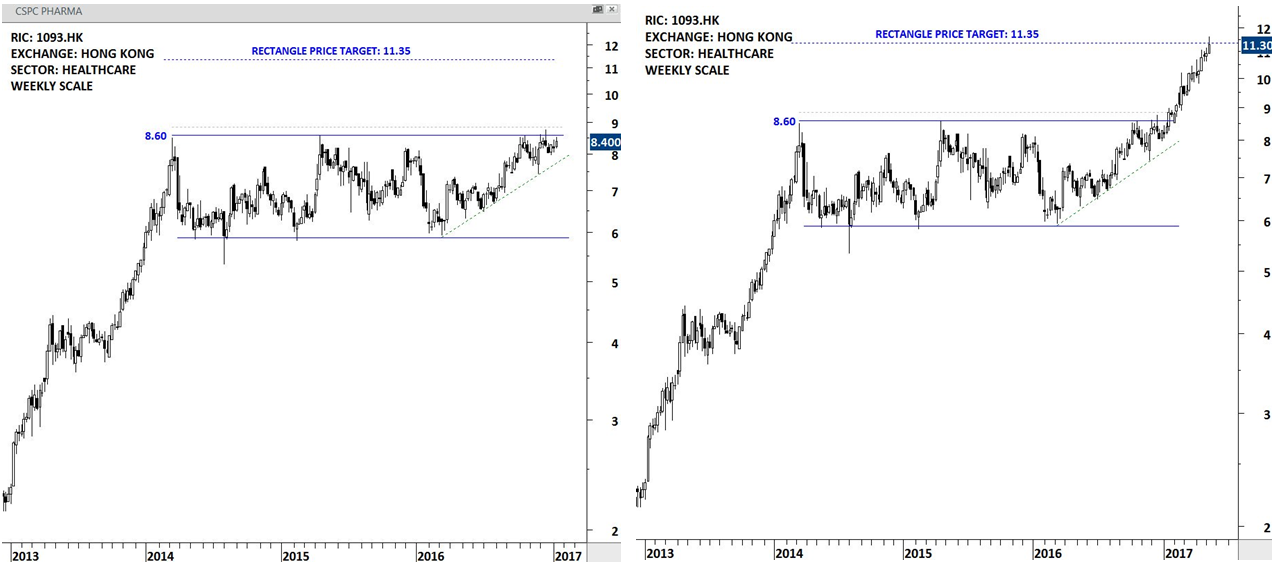
CSPC PHARMA
UPDATES ON THE BREAKOUT: GLOBAL EQUITY MARKETS REPORT / TWITTER
In January 2017, CSPC PHARMA completed a multi year-long rectangle chart pattern. Following the breakout, it took 16 weeks for the stock to reach its chart pattern price target. Breakouts from chart patterns with horizontal boundaries are usually reliable and breakouts from long-term chart patterns result in lengthy uptrends.
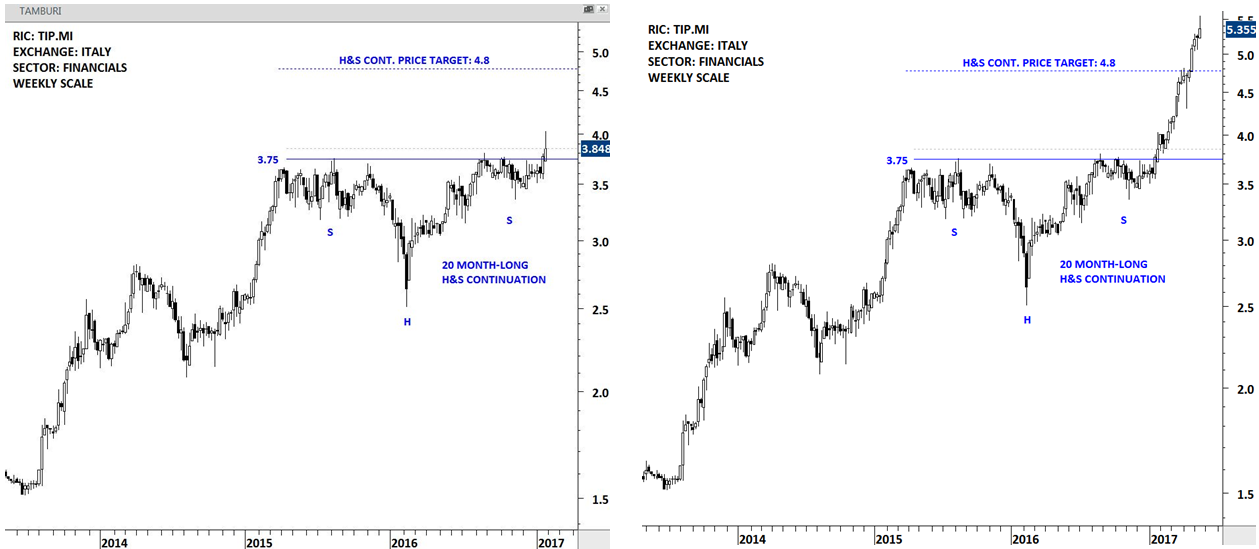
TAMBURI
UPDATES ON THE BREAKOUT: GLOBAL EQUITY MARKETS REPORT / TWITTER
In January 2017, TAMBURI completed a 20 month-long H&S continuation chart pattern. H&S continuation is one of those classical chart patterns with a well-defined horizontal boundary. Breakouts from H&S continuation that pushes stocks to all time high levels usually offer great long-term opportunity. Following the breakout, it took 10 weeks for TAMBURI to reach its chart pattern price target.
FAURECIA
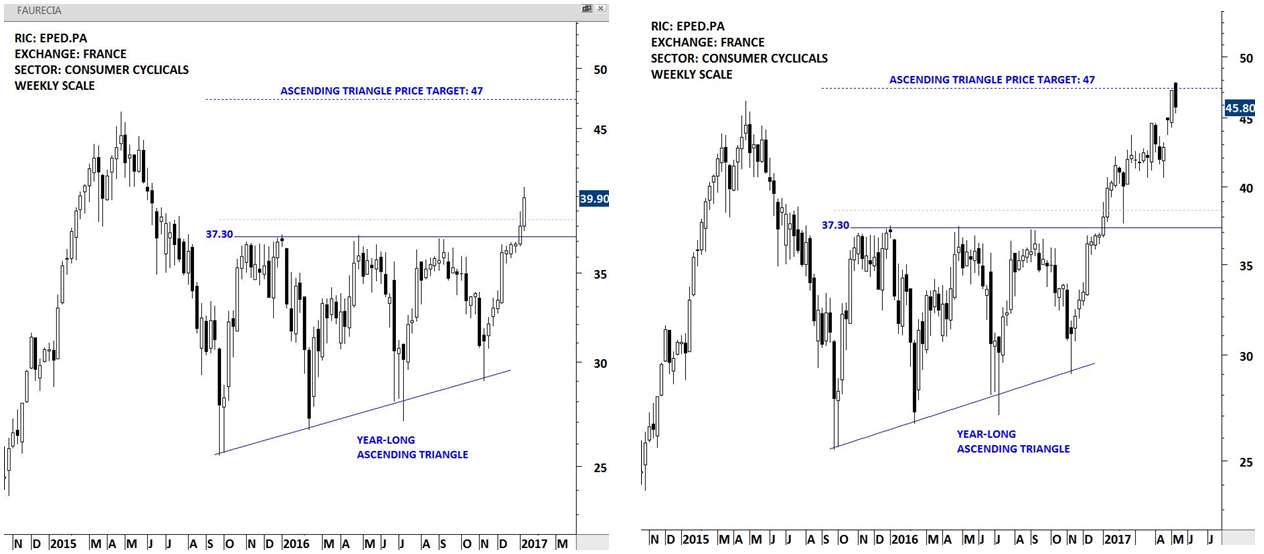
UPDATES ON THE BREAKOUT: GLOBAL EQUITY MARKETS REPORT / TWITTER
In January 2017, FAURECIA completed a year-long ascending triangle chart pattern. While ascending triangle is usually continuation in nature, after long downtrends it can act as a major bottom reversal chart pattern. Following the breakout, it took 16 weeks for FAURECIA to reach its chart pattern price target. Breakouts from chart patterns with horizontal boundaries are usually reliable.
SALVATORE FERRAGAMO
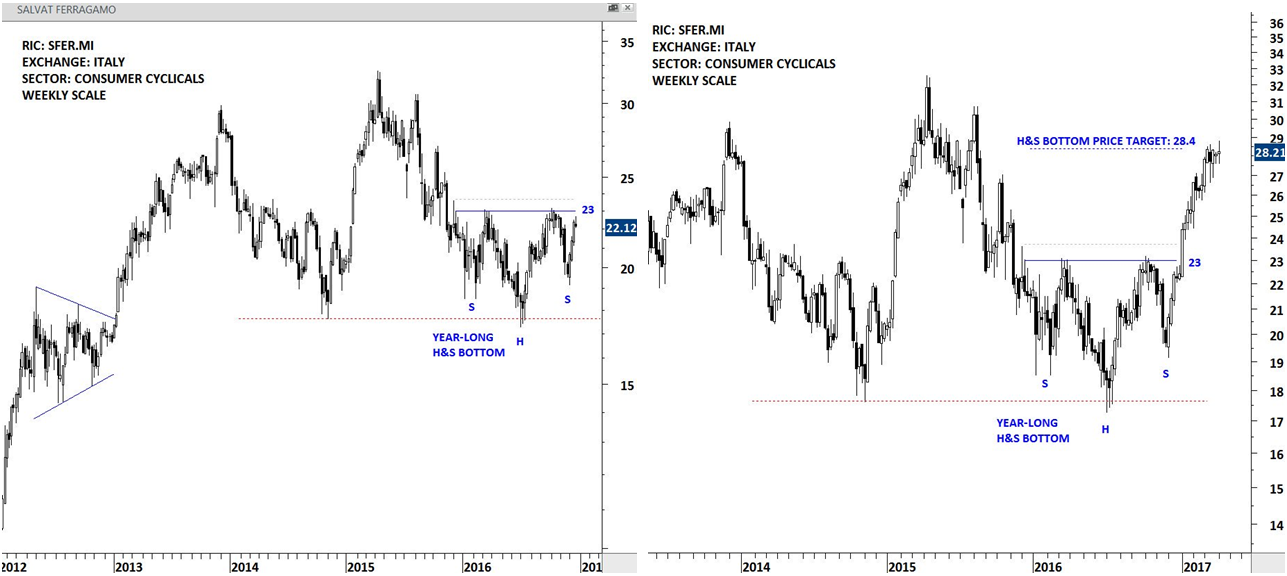
UPDATES ON THE BREAKOUT: TWITTER
In January 2017, SALVATORE FERRAGAMO completed a year-long H&S bottom chart pattern. H&S bottom is a bullish reversal chart pattern. Following the breakout, it took 9 weeks for the stock to reach its chart pattern price target. H&S bottom with horizontal neckline is more reliable compared to those with downward/upward sloping necklines.
LIBERTY INTERACTIVE
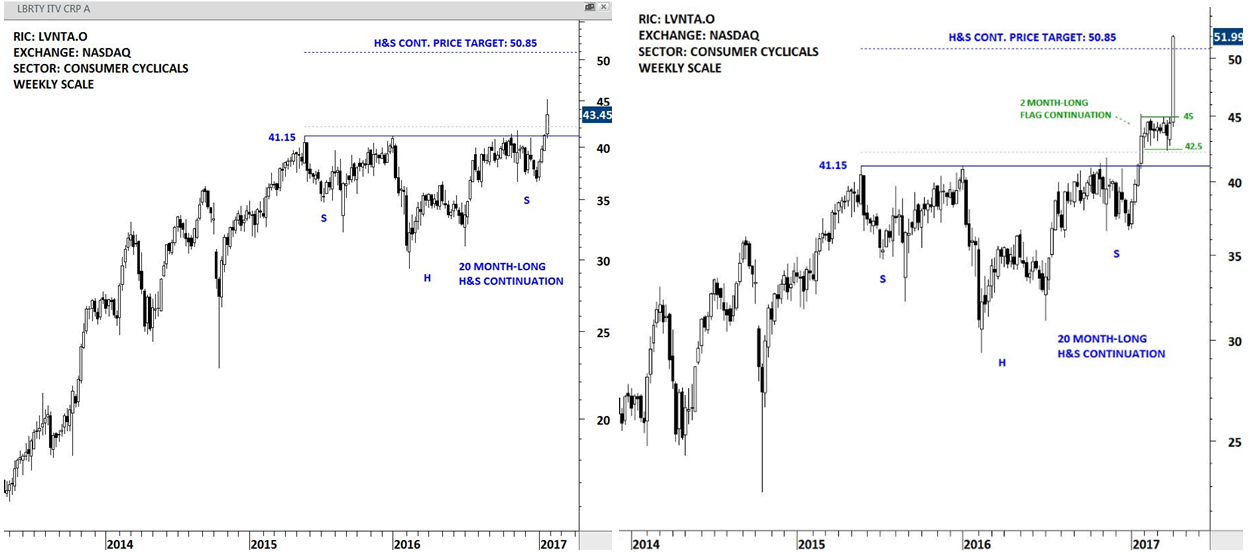
UPDATES ON THE BREAKOUT: GLOBAL EQUITY MARKETS REPORT / TWITTER
In January 2017, LIBERTY INTERACTIVE completed a 20 month-long H&S continuation chart pattern. H&S continuation is one of those formations with a well-defined horizontal boundary. Breakouts from H&S continuation that pushes stocks to all time high levels usually offer great long-term opportunity. Following the breakout, it took 10 weeks for LIBERTY INTERACTIVE to reach its chart pattern price target.
FORMPIPE
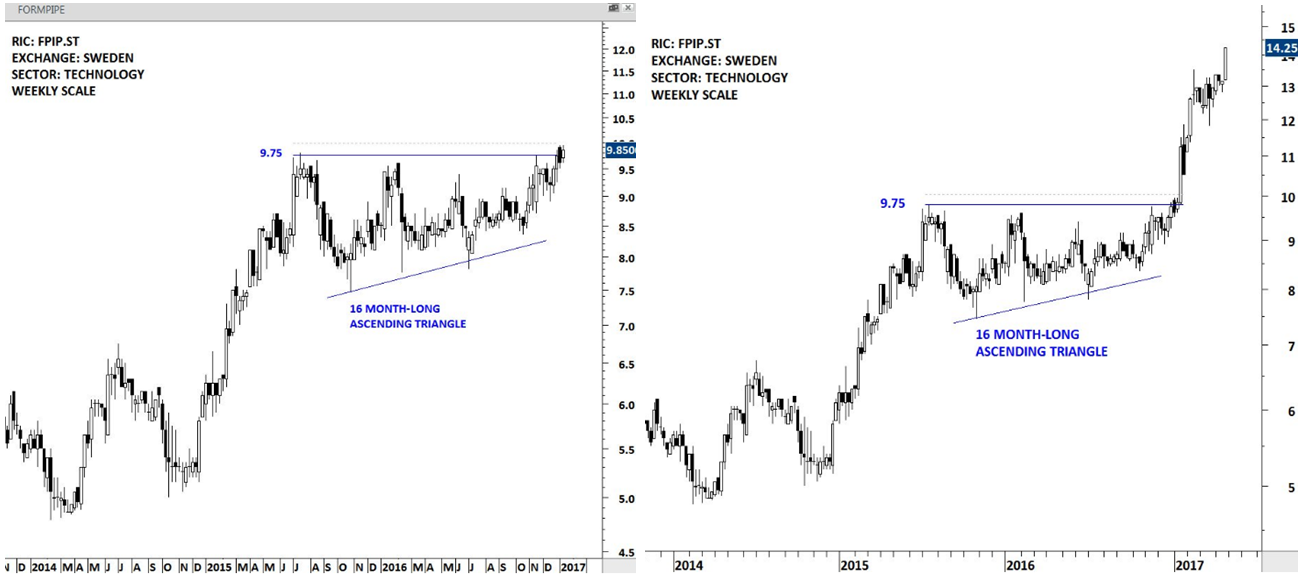
UPDATES ON THE BREAKOUT: GLOBAL EQUITY MARKETS REPORT / TWITTER
In January 2017, FORMPIPE completed a 16 month-long ascending triangle. Ascending triangles are bullish continuation chart patterns. The horizontal boundary and higher lows gives the pattern its bullish characteristic. FORMPIPE continues to remain in a steady uptrend.
SINGAPORE STRAIT TIMES INDEX
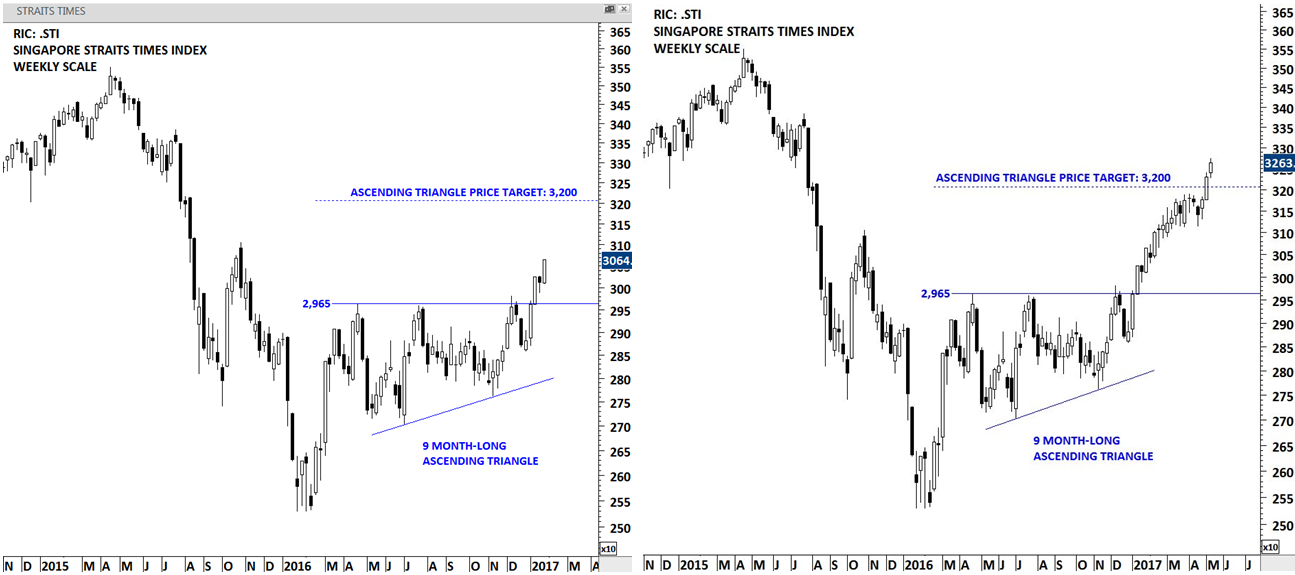
UPDATES ON THE BREAKOUT: GLOBAL EQUITY MARKETS REPORT / TWITTER
In January 2017, SINGAPORE STRAIT TIMES INDEX completed a 9 month-long bullish ascending triangle. The bullish chart pattern acted as a continuation. Several tests of the pattern boundary increase the likelihood of a decisive breakout. Breakouts from chart patterns with horizontal boundaries are usually reliable. Following the breakout, it took 14 weeks for SINGAPORE STRAIT TIMES INDEX to reach its chart pattern price target.
DAIRY FARM
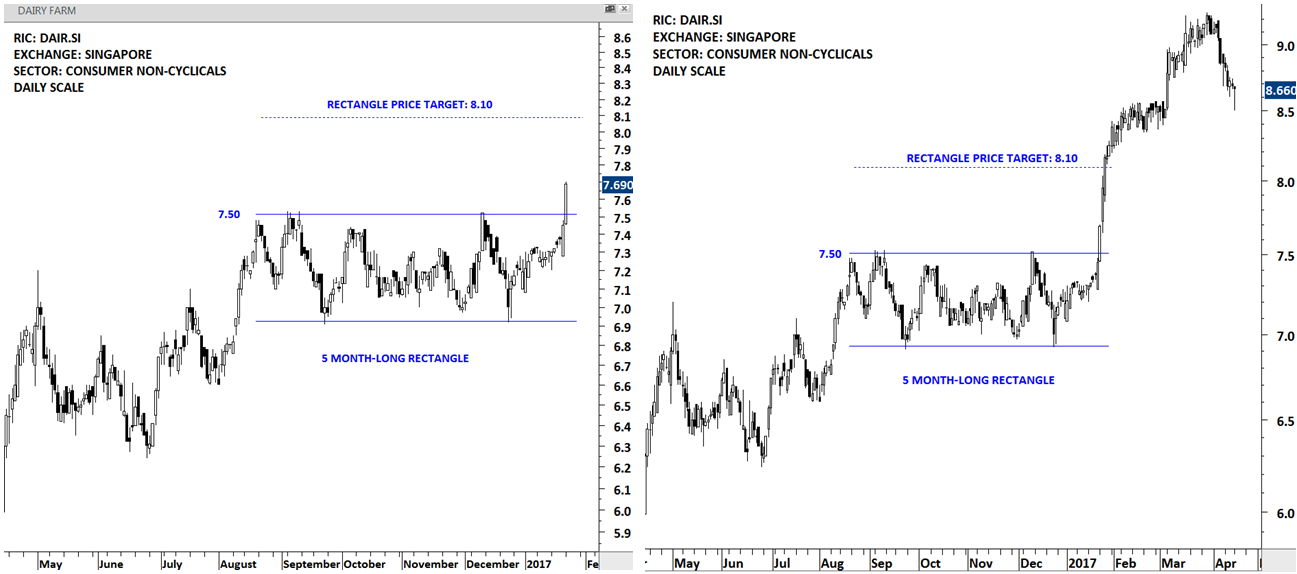
UPDATES ON THE BREAKOUT: GLOBAL EQUITY MARKETS REPORT / TWITTER
In January 2017, DAIRY FARM completed a 5 month-long rectangle chart pattern. Daily chart showed strong gains following the breakout. Chart pattern price target was met in the following week. Breakouts from chart patterns with horizontal boundaries are usually reliable.
ASTRAL FOODS
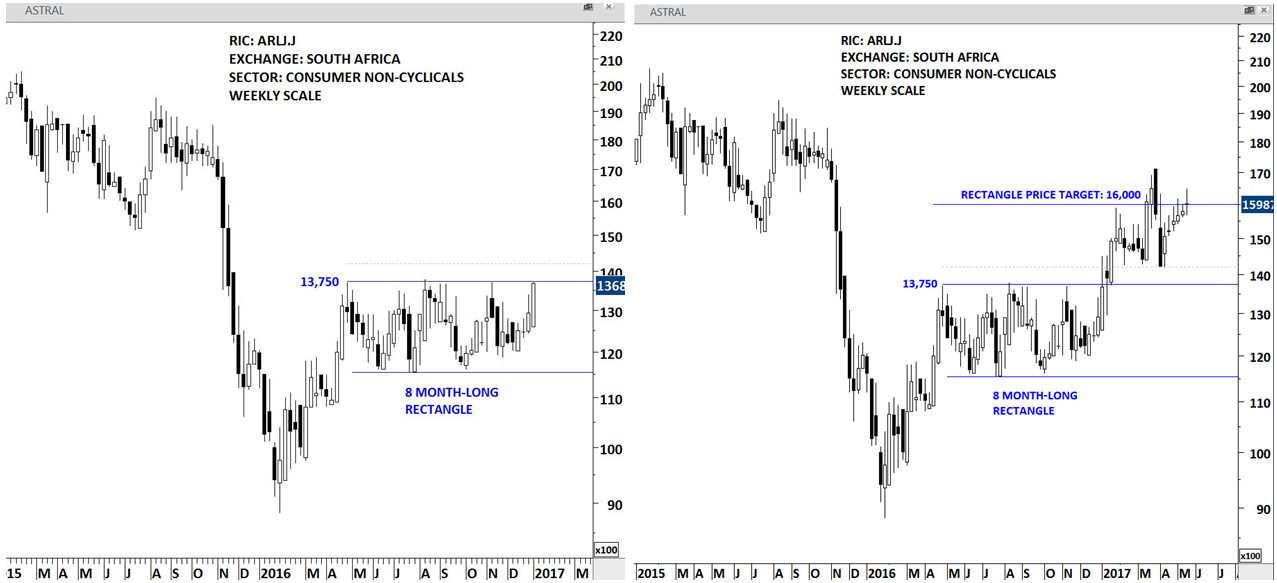
UPDATES ON THE BREAKOUT: GLOBAL EQUITY MARKETS REPORT / TWITTER
In January 2017, ASTRAL FOODS completed an 8 month-long rectangle chart pattern. Following the breakout, it took 8 weeks for the stock to reach its chart pattern price target. Breakouts from chart patterns with horizontal boundaries are usually reliable. Several tests of the pattern boundary increase the likelihood of a decisive breakout.
SANCHEZ ENERGY
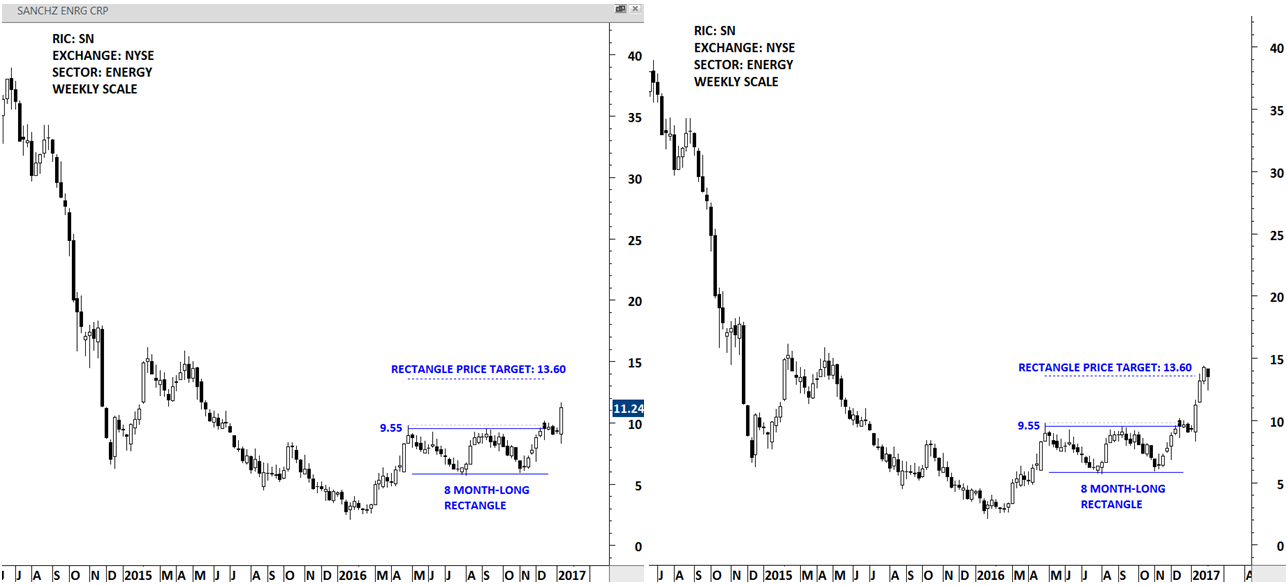
UPDATES ON THE BREAKOUT: GLOBAL EQUITY MARKETS REPORT / TWITTER
In January 2017, SANCHEZ ENERGY completed an 8 month-long rectangle chart pattern. Following the breakout, it took 1 week for the stock to reach its chart pattern price target. Breakouts from chart patterns with horizontal boundaries are usually reliable. Several tests of the pattern boundary increase the likelihood of a decisive breakout.
SUNAC CHINA HOLDING
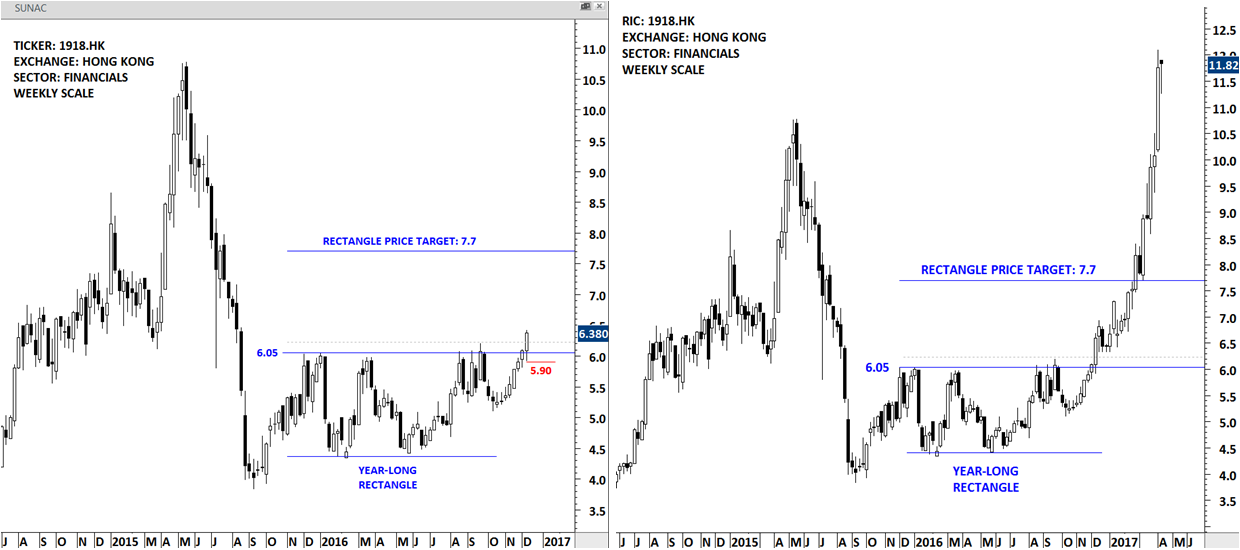
UPDATES ON THE BREAKOUT: GLOBAL EQUITY MARKETS REPORT / TWITTER
In December 2016, SUNAC CHINA HOLDING completed a year-long rectangle chart pattern. Rectangle is a continuation chart pattern. However, after long downtrends it can act as a major reversal chart pattern. The stock tested the chart pattern boundary several times before the breakout took place. Breakouts from chart patterns with horizontal boundaries are usually reliable and several tests of the pattern boundary increase the likelihood of a decisive breakout. Following the breakout, it took 12 weeks for the stock to reach its chart pattern price target.
GERMANY DAX INDEX
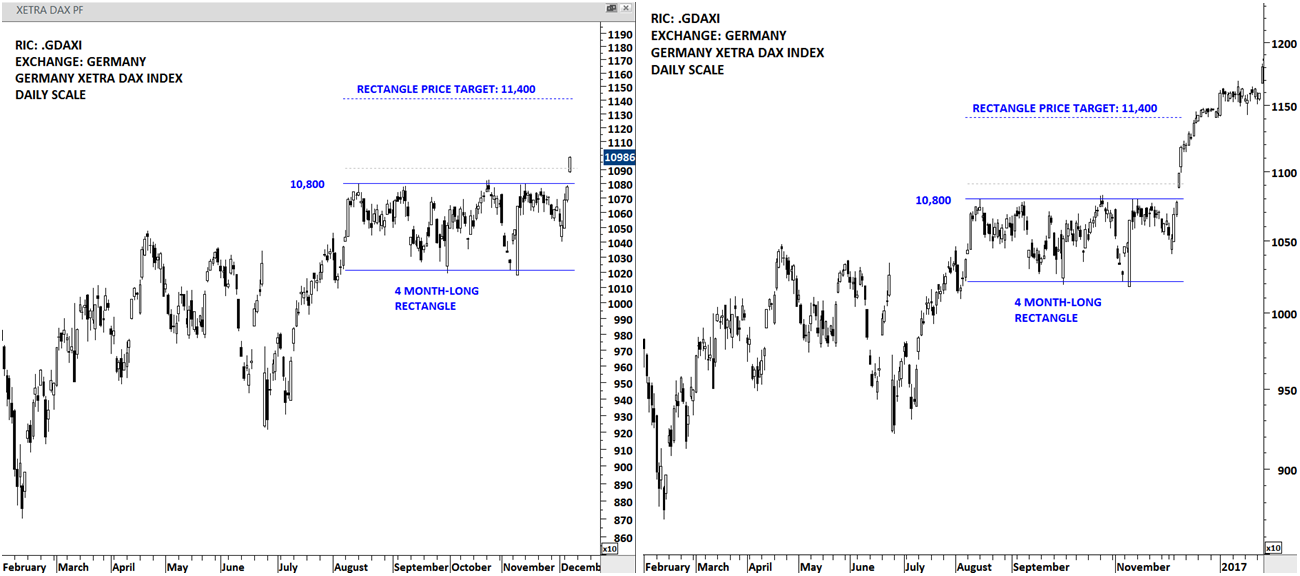
UPDATES ON THE BREAKOUT: GLOBAL EQUITY MARKETS REPORT / TWITTER
In December 2016, GERMANY DAX INDEX completed a 4 month-long rectangle continuation chart pattern. The stock tested the chart pattern boundary several times before the breakout took place. Breakouts from chart patterns with horizontal boundaries are usually reliable. Following the breakout, it took 7 days for the index to reach its chart pattern price target.
INTERFOR CORPORATION
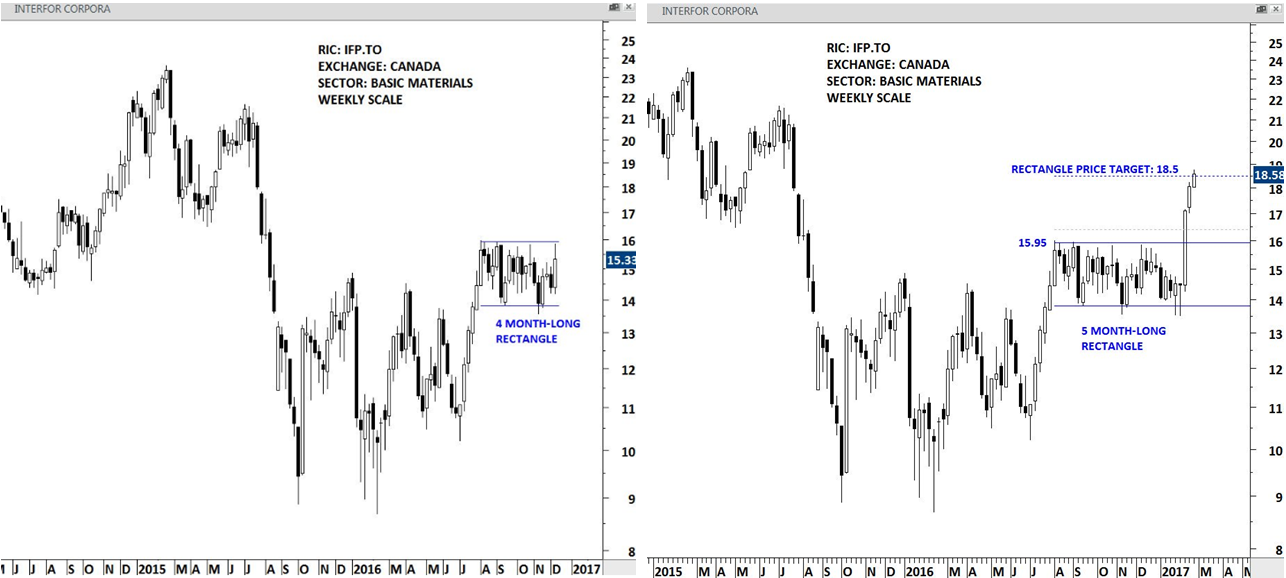
UPDATES ON THE BREAKOUT: GLOBAL EQUITY MARKETS REPORT / TWITTER
In December 2016, INTERFOR CORPORATION completed a 5 month-long rectangle continuation chart pattern. The stock tested the chart pattern boundary several times before the breakout took place. Breakouts from tight consolidation ranges can take place with strong momentum and exceed possible chart pattern price target. Following the breakout, it took 2 weeks for the stock to reach its chart pattern price target.
DAIWA INDUSTRIES
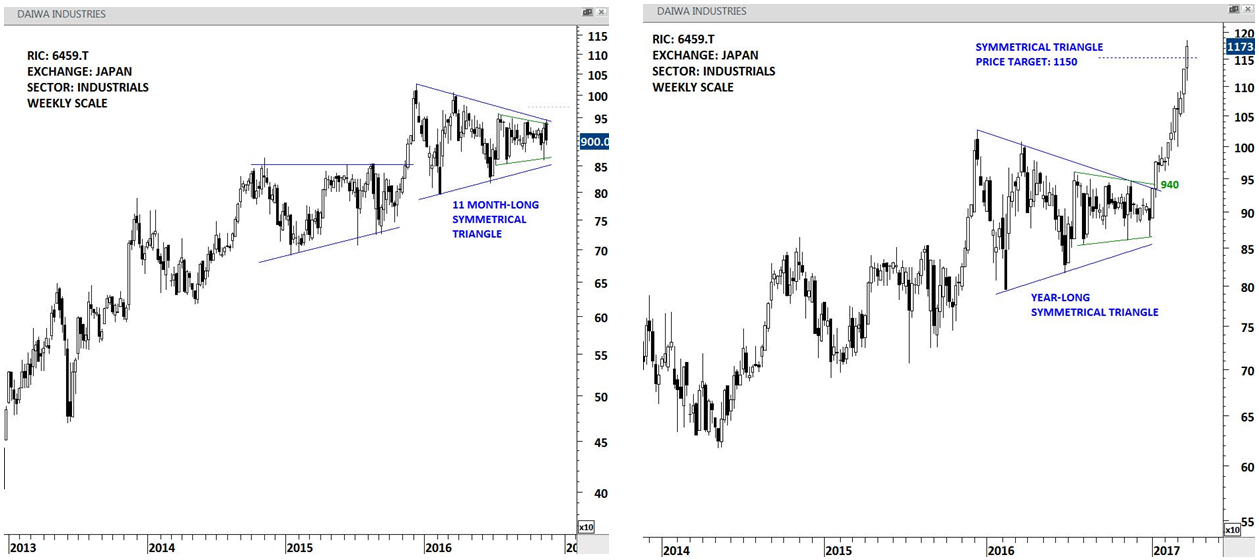
UPDATES ON THE BREAKOUT: TWITTER
In November 2016, DAIWA INDUSTRIES completed an 11 month-long symmetrical triangle continuation chart pattern. The stock tested the chart pattern boundary several times before the breakout took place. Breakouts from tight consolidation ranges can take place with strong momentum and exceed possible chart pattern price target. Following the breakout, it took 10 weeks for the stock to reach its chart pattern price target.
OMV
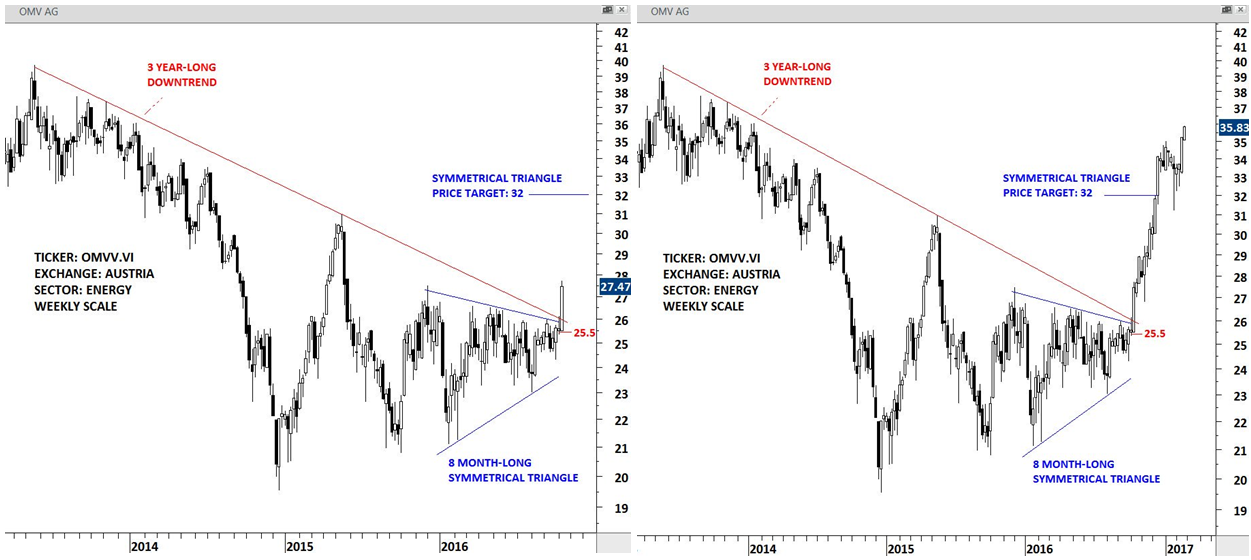
UPDATES ON THE BREAKOUT: GLOBAL EQUITY MARKETS REPORT / TWITTER
In October 2016, OMV completed an 8 month-long symmetrical triangle chart pattern that acted as a reversal. After long downtrends symmetrical triangle can act as a reversal chart pattern. The stock tested the chart pattern boundary several times before the breakout took place. It is best when stock clears more than one important technical resistance. In this case the stock breached a 3 year-long downtrend as well as breaking out of a symmetrical triangle reversal chart pattern. Following the breakout, it took 8 weeks for the stock to reach its chart pattern price target.
KVAERNER
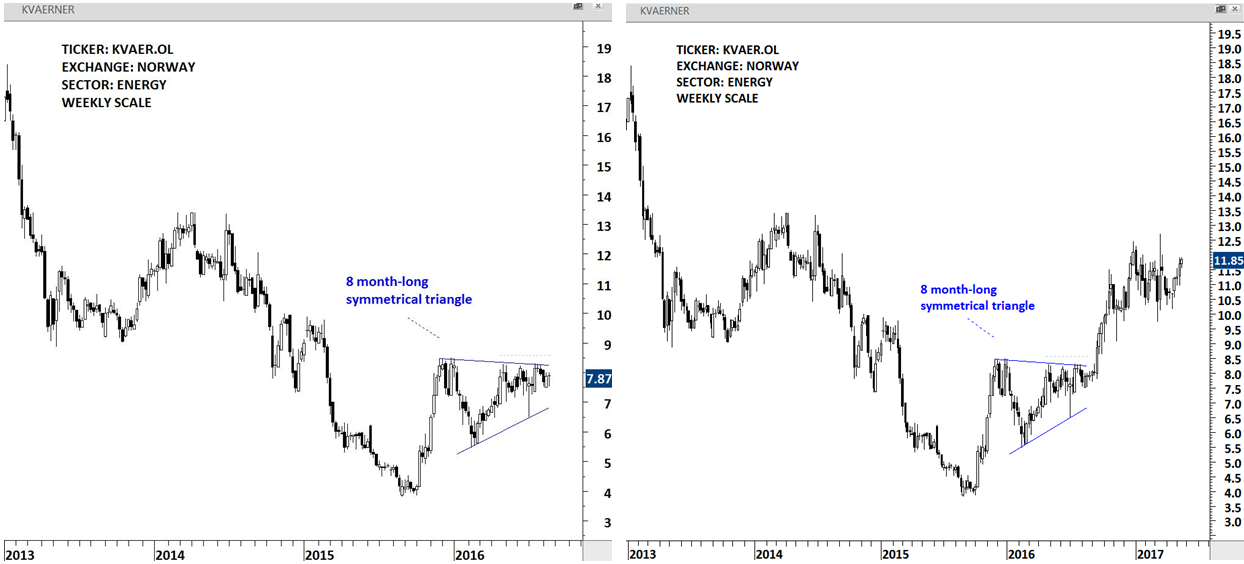
UPDATES ON THE BREAKOUT: TWITTER
In October 2016, KVAERNER completed an 8 month-long symmetrical triangle continuation chart pattern. The stock tested the chart pattern boundary several times before the breakout took place. Following the breakout, it took 5 weeks for the stock to reach its chart pattern price target.
MGM CHINA
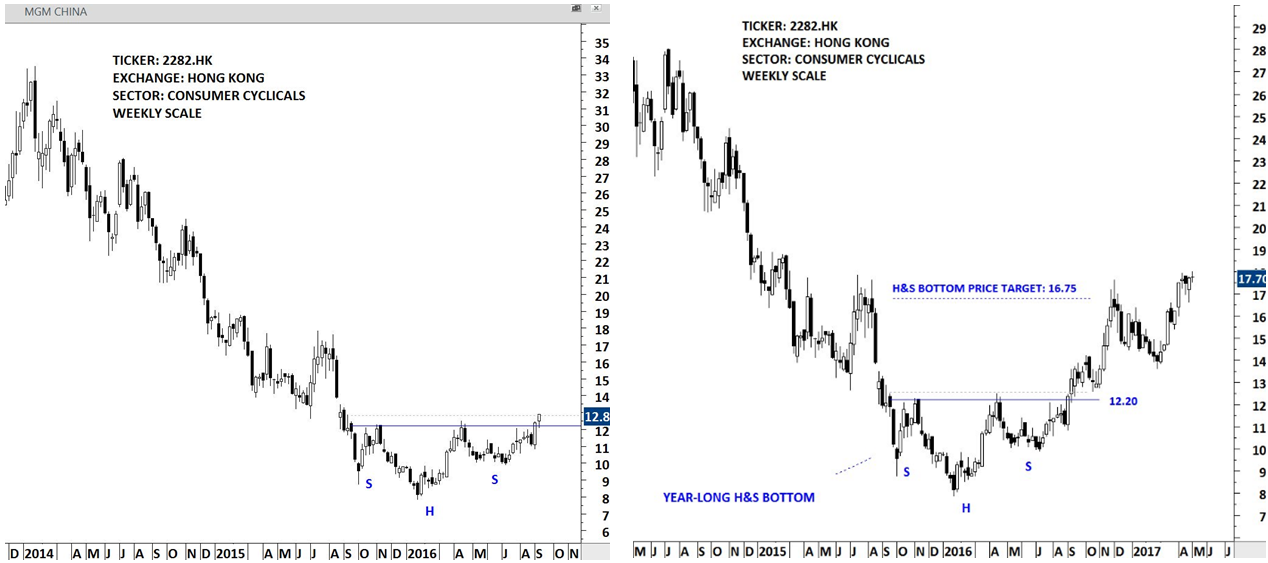
UPDATES ON THE BREAKOUT: GLOBAL EQUITY MARKETS REPORT / TWITTER
In September 2016, MGM CHINA completed a year-long H&S bottom chart pattern. H&S chart pattern with horizontal boundaries is more reliable than H&S chart pattern with a slanting neckline. Following the breakout, it took 11 weeks for the stock to reach its chart pattern price target.
FABEGE
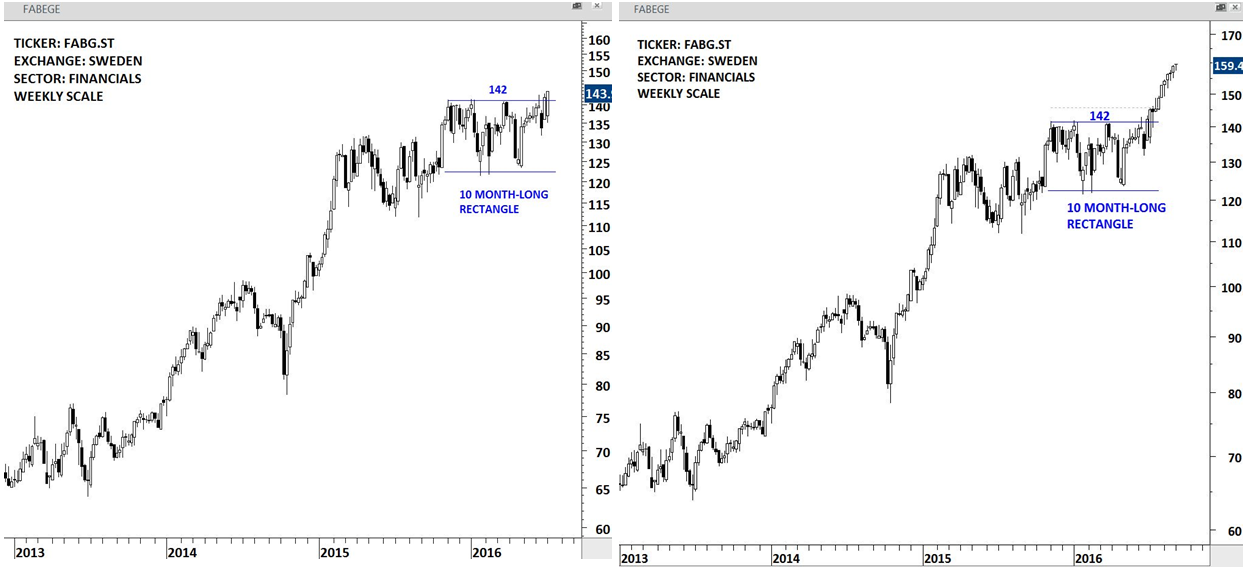
UPDATES ON THE BREAKOUT: TWITTER
In July 2016, FABEGE completed a 10 month-long rectangle continuation chart pattern. The stock tested the chart pattern boundary several times before the breakout took place. Following the breakout, it took 8 weeks for the stock to reach its chart pattern price target.
LOGITECH
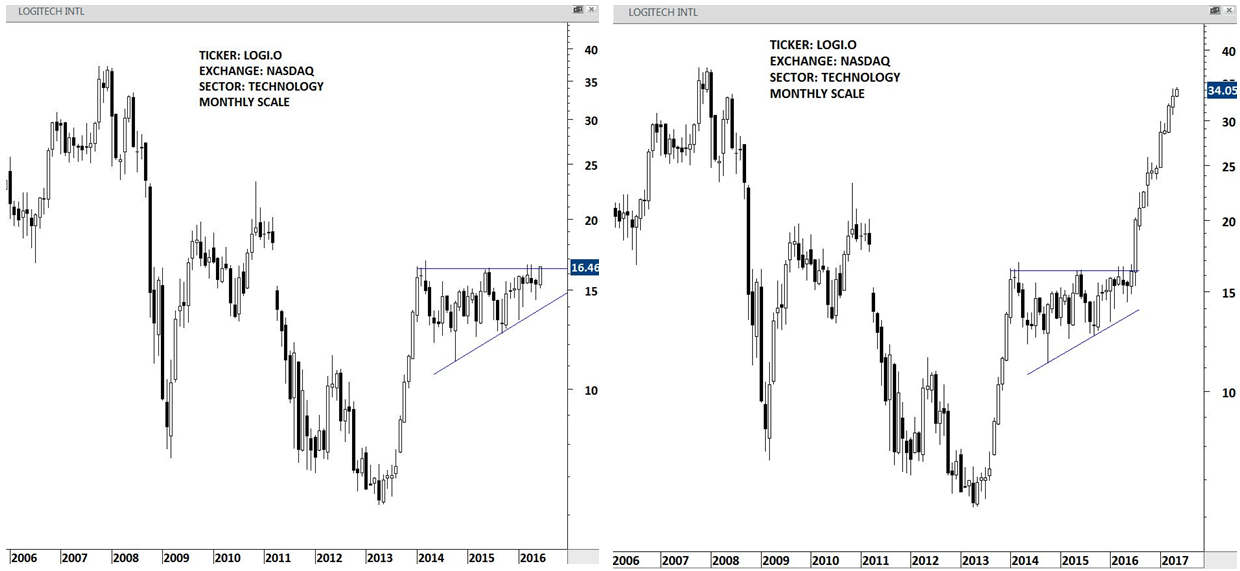
UPDATES ON THE BREAKOUT: TWITTER
In July 2016, LOGITECH completed an 2 year-long ascending triangle continuation chart pattern. Breakouts from tight consolidations usually result in strong trend periods. Before the strong breakout took place the stock tested the chart pattern boundary several times.
VENTURE
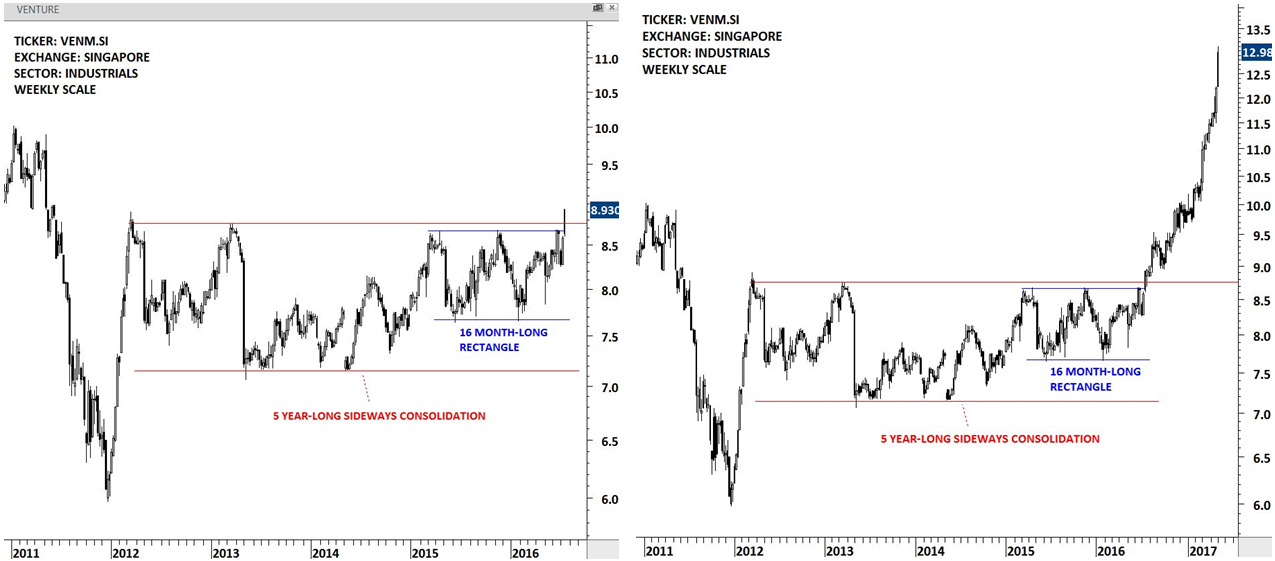
UPDATES ON THE BREAKOUT: TWITTER
In July 2016, VENTURE completed a 5 year-long well-defined consolidation range. Before the breakout, the stock formed another 16 month-long rectangle. Both breakouts took place at the same level. The 16 month-long rectangle acted as a launching pattern. Breakouts from long-term consolidations are significant as they are usually followed by multi-month trend periods.
LAM RESEARCH
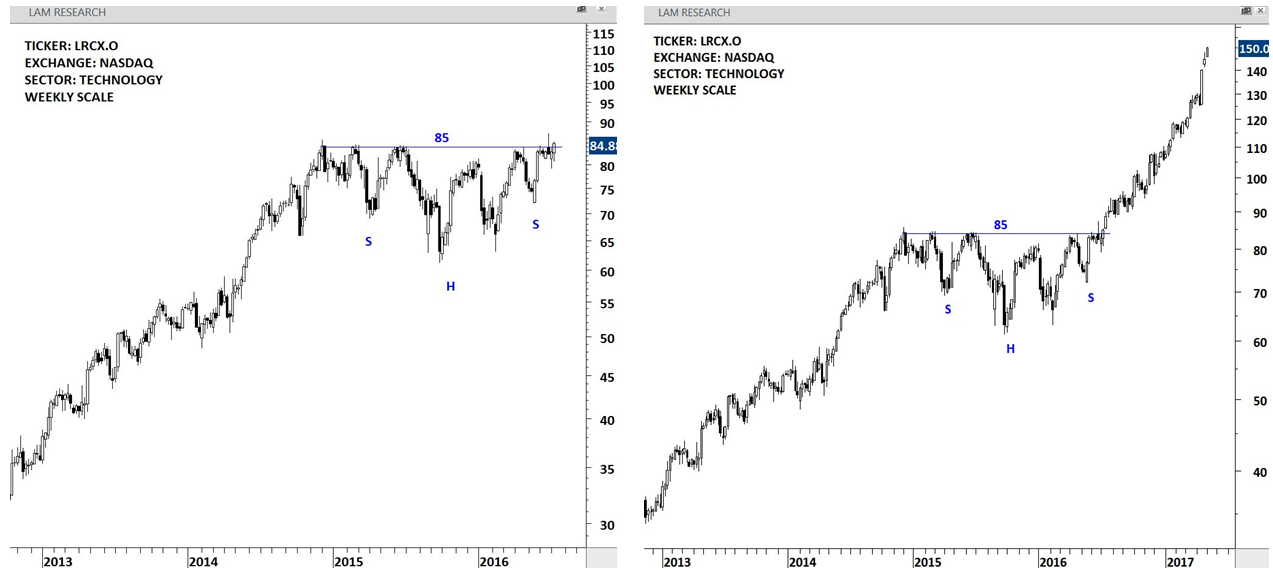
UPDATES ON THE BREAKOUT: TWITTER
In July 2016, LAM RESEARCH completed a 20 month-long H&S continuation chart pattern. The stock tested the chart pattern boundary several times before the breakout took place. Breakouts from long-term consolidations are significant as they are usually followed by multi-month trend periods.
BREAKOUTS THAT ARE STILL IN PROGRESS
NETFLIX
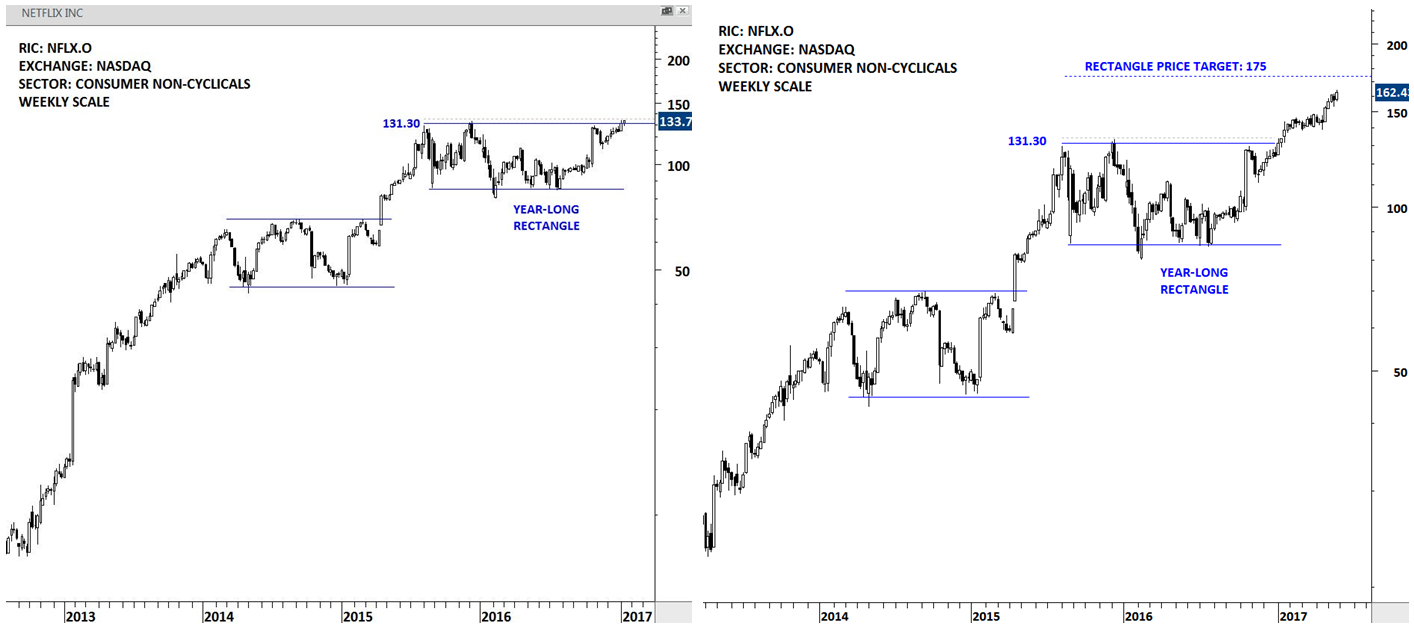
UPDATES ON THE BREAKOUT: GLOBAL EQUITY MARKETS REPORT / TWITTER
In January 2017, NETFLIX completed a year-long rectangle continuation chart pattern. The chart pattern boundary was tested 3 times before the breakout took place. Breakouts from chart patterns with horizontal boundaries are usually reliable. NETFLIX is still trending higher towards its possible chart pattern price target at 175 levels.
UK FTSE 100 INDEX
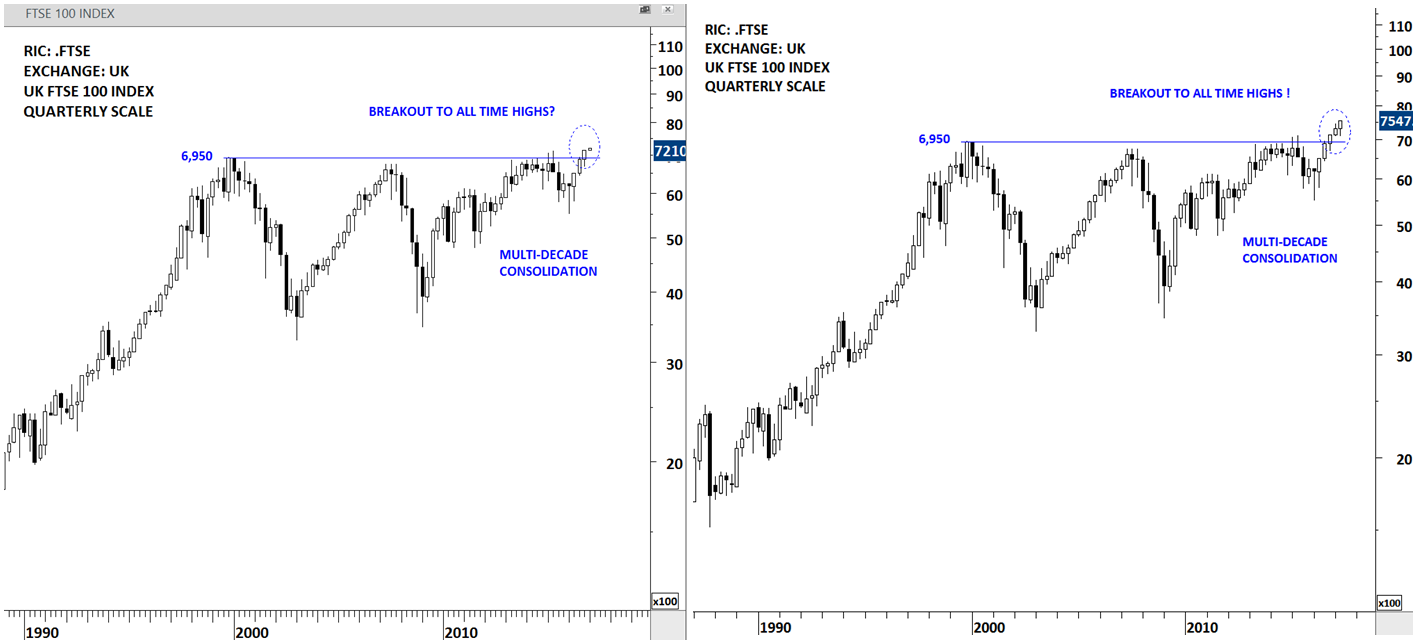
UPDATES ON THE BREAKOUT: GLOBAL EQUITY MARKETS REPORT / TWITTER
In January 2017, UK FTSE 100 INDEX completed a multi-decade consolidation and broke out to all-time high levels. Price that clears a strong horizontal resistance and also reaches all-time highs are usually followed by strong trend periods.
FLEXSHARES INTL QUALITY DIVIDEND INDEX ETF
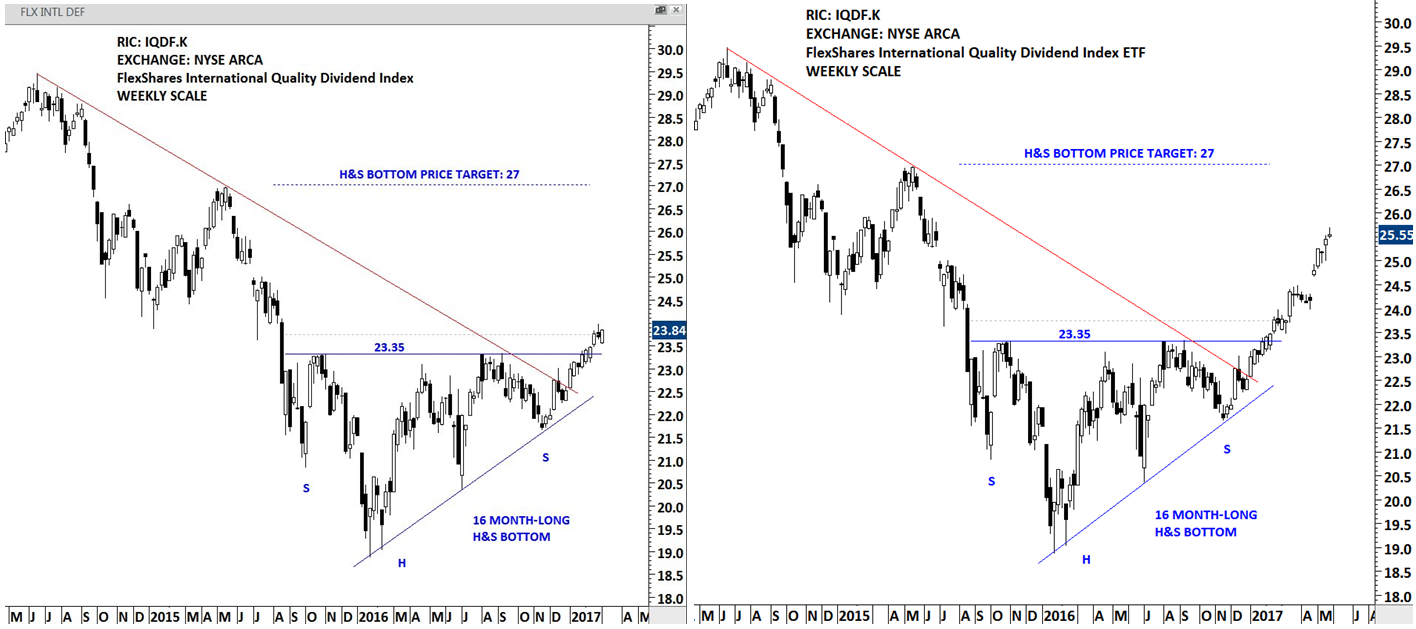
UPDATES ON THE BREAKOUT: GLOBAL EQUITY MARKETS REPORT / TWITTER
In February 2017, FLEXSHARES INTL QUALITY DIVIDEND ETF completed a 16 month-long H&S bottom reversal. The chart pattern can also be identified as an ascending triangle. The breakout not only completed a multi-month base formation but also reversed a 3 year-long downtrend. FLEXSHARES INTL QUALITY DIVIDEND ETF is still trending higher towards its possible chart pattern price target at 27 levels.
BOYD GAMING
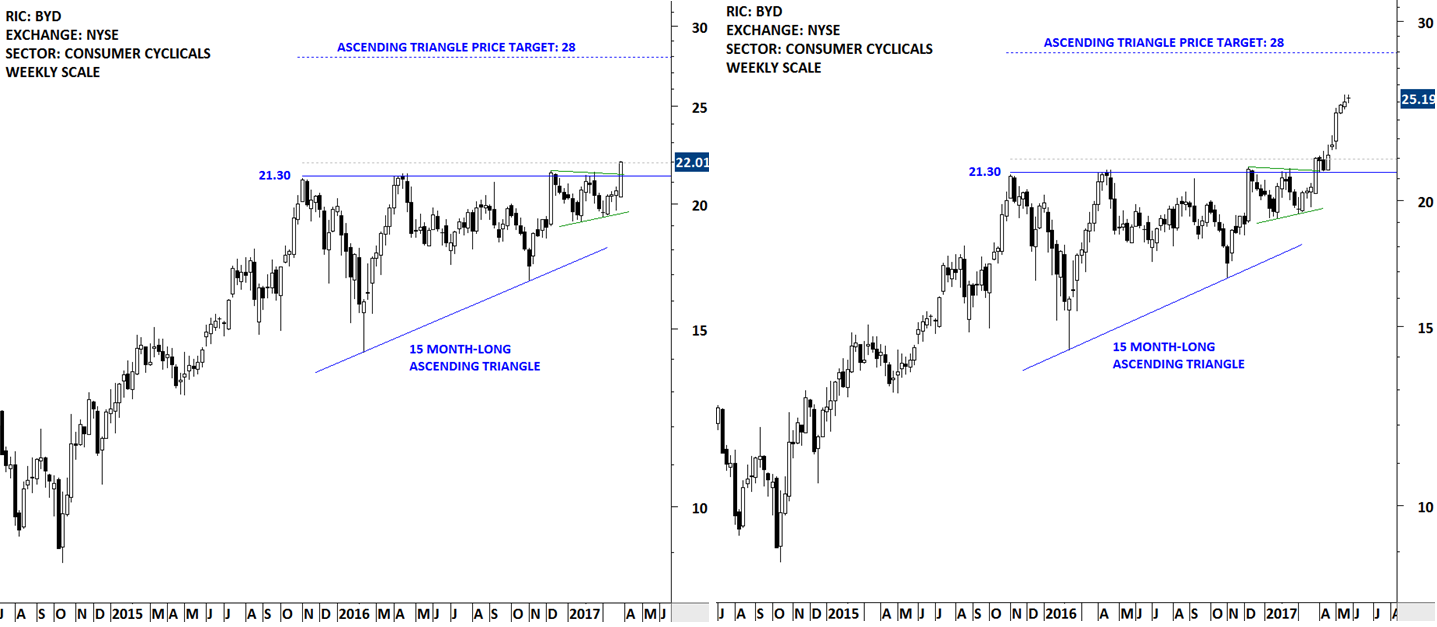
UPDATES ON THE BREAKOUT: GLOBAL EQUITY MARKETS REPORT / TWITTER
In March 2017, BOYD GAMING completed a 15 month-long ascending triangle continuation. Before the breakout took place the stock formed a 4 month-long symmetrical triangle that acted as a launching pattern. The horizontal boundary of the ascending triangle was tested several times before the breakout took place. Richard W. Schabacker is quoted as saying: “The greater number of extremes touched by the trend line, the more dependable is that line.” In this case the breakout took place after 4 tests of the horizontal boundary. BOYD GAMING is still trending higher towards its possible chart pattern price target at 28 levels.
BBVA
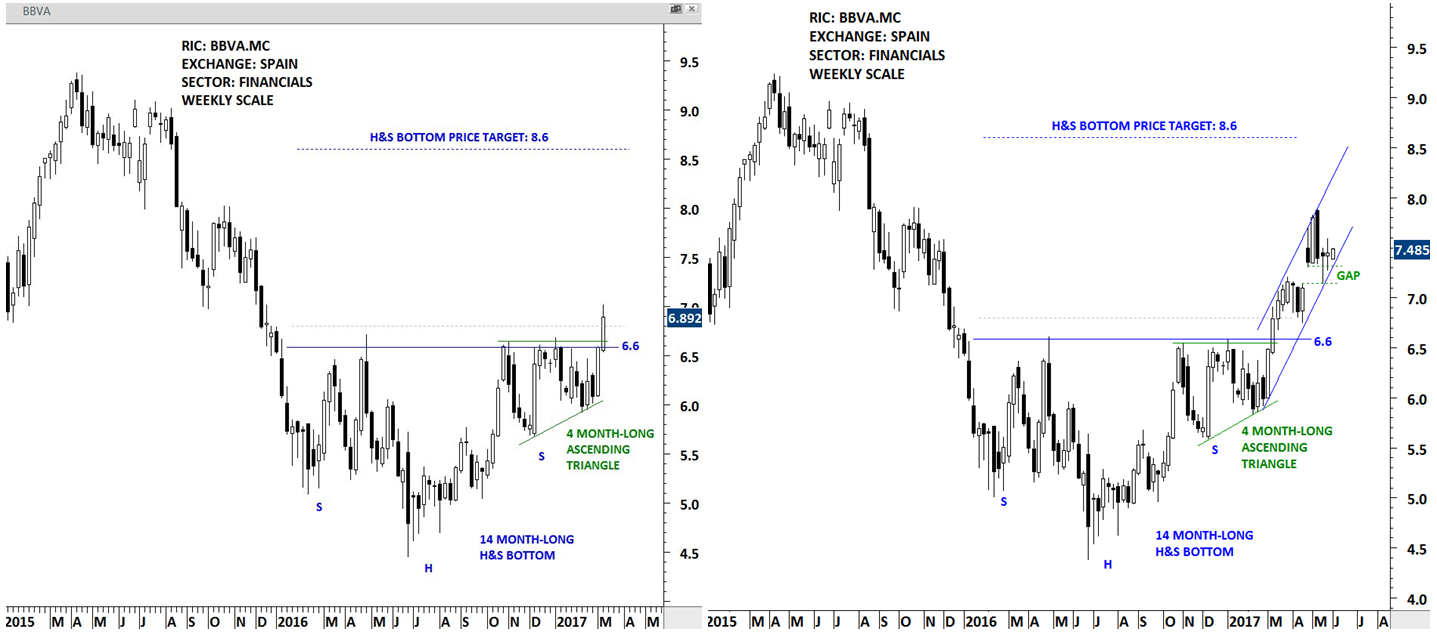
UPDATES ON THE BREAKOUT: GLOBAL EQUITY MARKETS REPORT / TWITTER
In March 2017, BBVA completed a 14 month-long H&S Bottom reversal. Before the breakout took place the stock formed a 4 month-long ascending triangle that acted as a launching pattern. The horizontal boundary of the H&S bottom was tested several times before the breakout took place. BBVA is still trending higher towards its possible chart pattern price target at 8.6 levels.
GLOBEX MSCI GREECE ETF – GREK
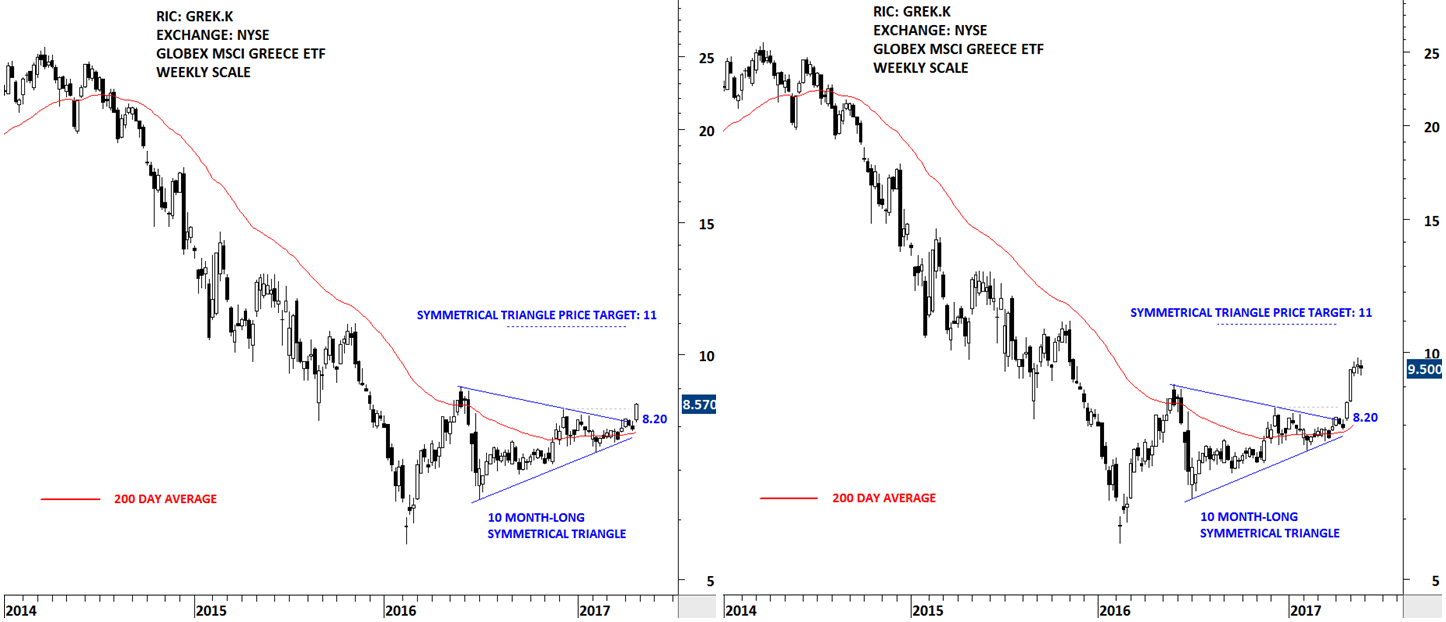
UPDATES ON THE BREAKOUT: GLOBAL EQUITY MARKETS REPORT / TWITTER
In April 2017, GREK completed a 10 month-long symmetrical triangle that acted as a reversal. After lengthy trends, symmetrical triangle can act as a reversal chart pattern. GREK not only broke out of a 10 month-long consolidation but also reversed a 2 year-long downtrend by pushing above the 200 day (40 week) average. GREK is still trending higher towards its possible chart pattern price target at 11 levels.
GREECE FTSE ATHEX MARKET INDEX
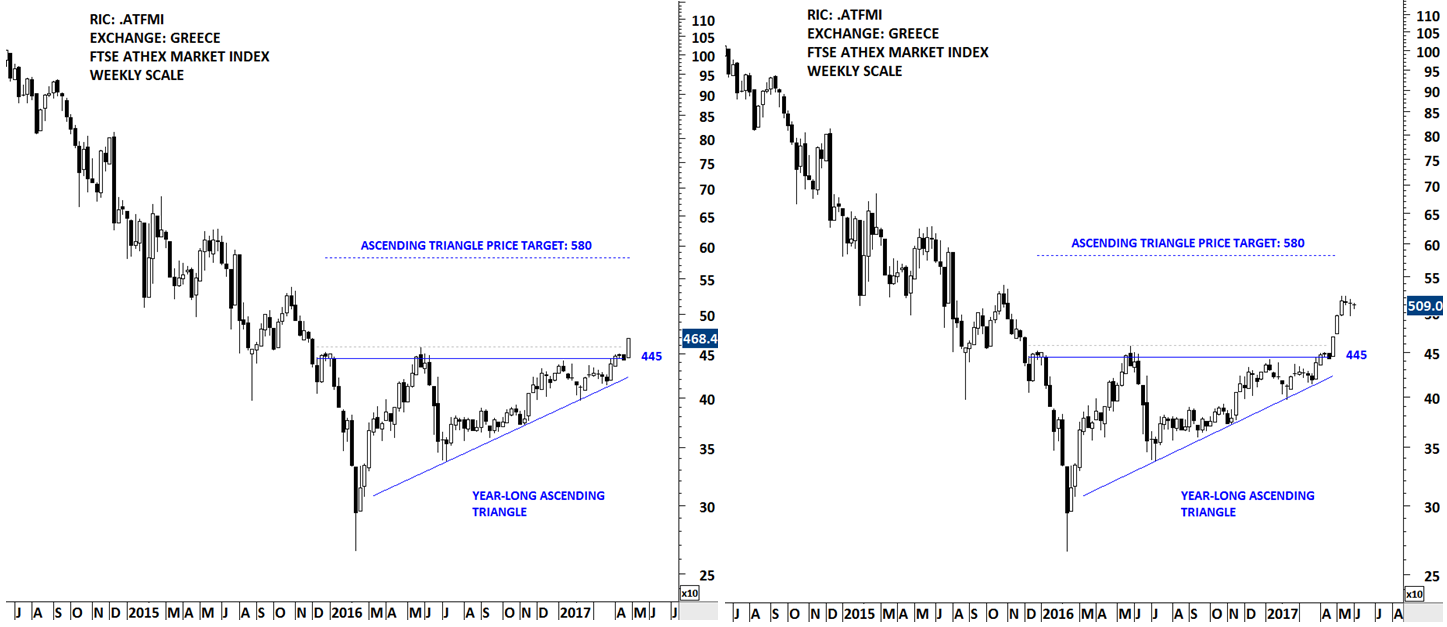
UPDATES ON THE BREAKOUT: GLOBAL EQUITY MARKETS REPORT / TWITTER
In April 2017, GREECE FTSE ATHEX INDEX completed a year-long ascending triangle that acted as a reversal. Ascending triangle is a bullish continuation chart pattern. However, after lengthy trends, ascending triangle can act as a reversal chart pattern. The horizontal boundary of the chart pattern was well-defined and was tested several times before the breakout took place. GREECE FTSE ATHEX INDEX is still trending higher towards its possible chart pattern price target at 580 levels.
RYANAIR HOLDINGS
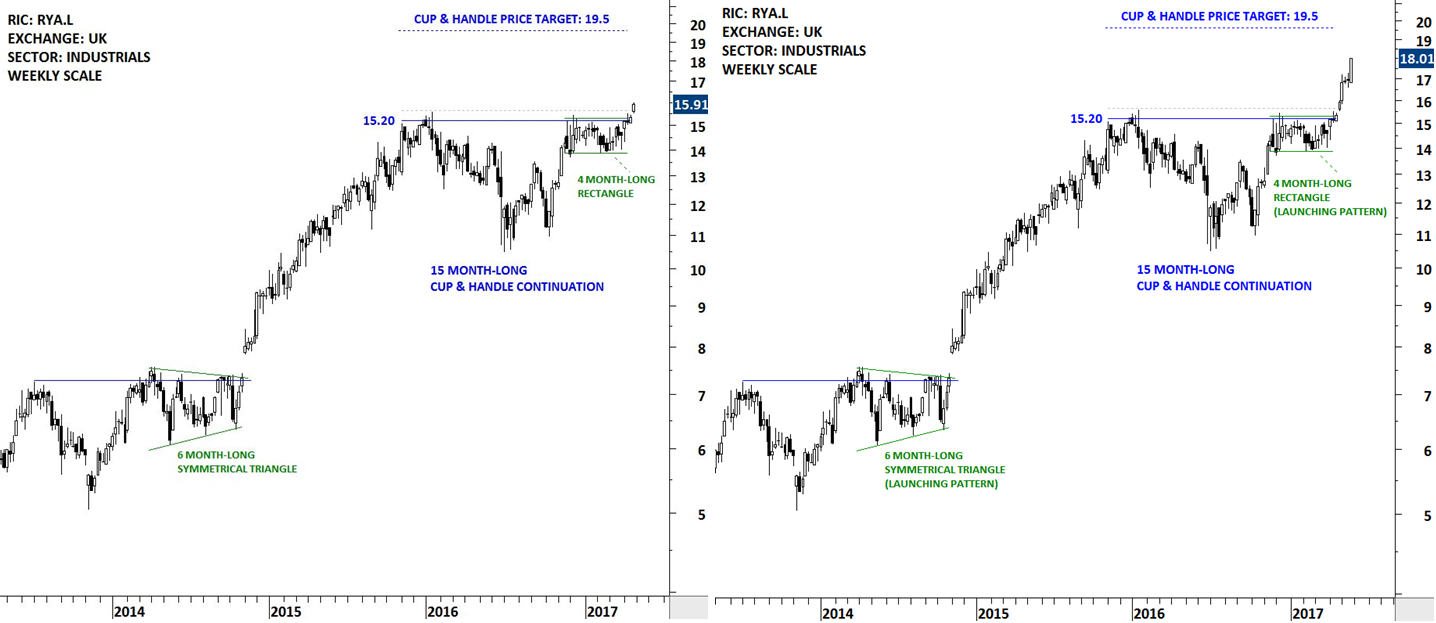
UPDATES ON THE BREAKOUT: GLOBAL EQUITY MARKETS REPORT / TWITTER
In April 2017, RYANAIR HOLDINGS completed a 15 month-long cup & handle chart pattern. Cup & handle is a bullish continuation chart pattern. The handle, which was a 4 month-long rectangle acted as a launching pattern. The horizontal boundary of the chart pattern was well-defined and tested several times before the breakout took place. RYANAIR HOLDINGS is still trending higher towards its possible chart pattern price target at 19.5 levels.
BELC CO
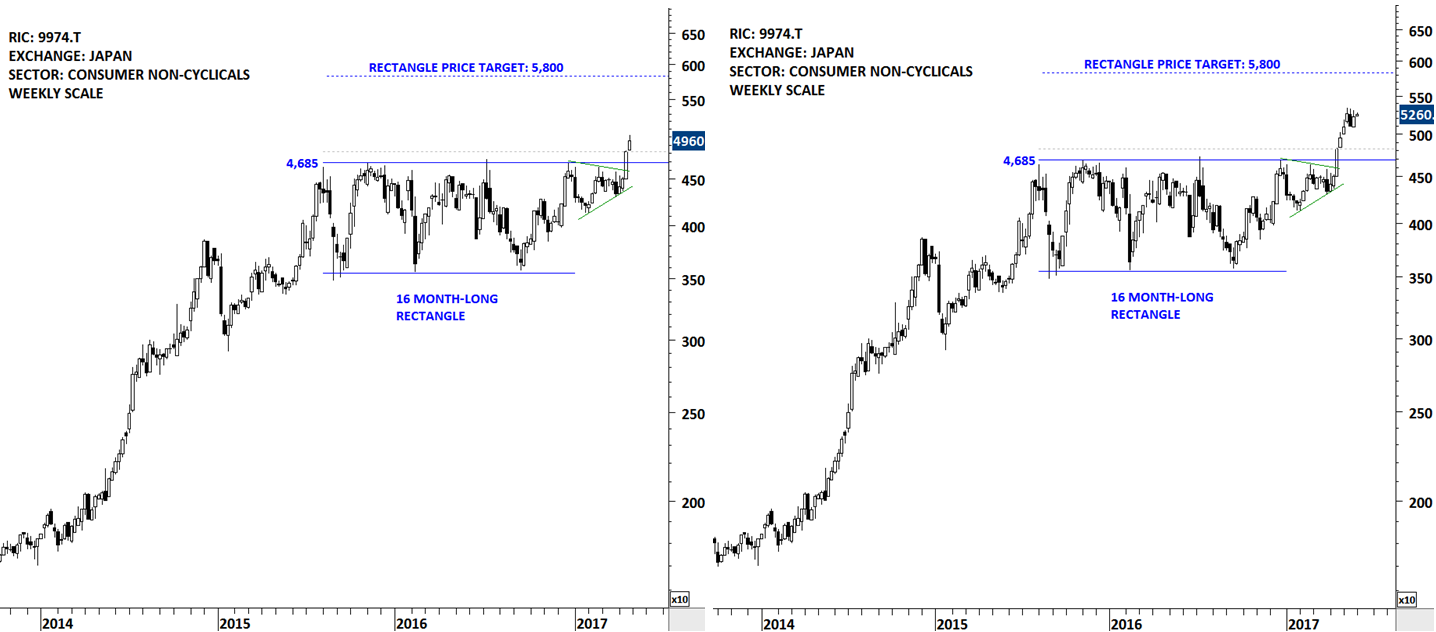
UPDATES ON THE BREAKOUT: GLOBAL EQUITY MARKETS REPORT / TWITTER
In April 2017, BELC CO completed a 16 month-long rectangle continuation chart pattern. Before the breakout took place the stock formed a 3 month-long symmetrical triangle that acted as a launching pattern. The horizontal boundary of the chart pattern was well-defined and tested several times before the breakout took place. BELC CO is still trending higher towards its possible chart pattern price target at 5,800 levels.
HEALTHSOUTH CP
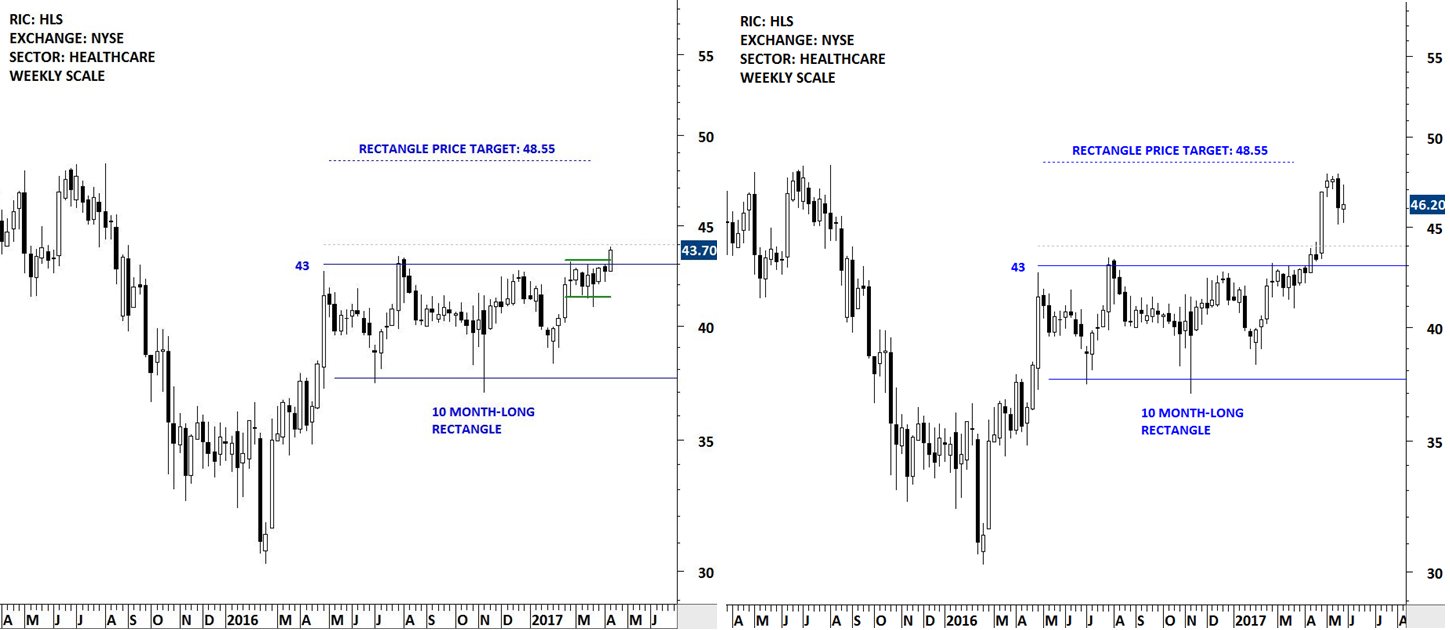
UPDATES ON THE BREAKOUT: GLOBAL EQUITY MARKETS REPORT / TWITTER
In April 2017, HEALTHSOUTH CP completed a 10 month-long rectangle continuation chart pattern. Before the breakout took place the stock formed a 2 month-long flag that acted as a launching pattern. The horizontal boundary of the chart pattern was well-defined and tested several times before the breakout took place. HEALTHSOUTH CP is still trending higher towards its possible chart pattern price target at 48.55 levels.


