ISHARES INTERNATIONAL PREFERRED STOCK ETF

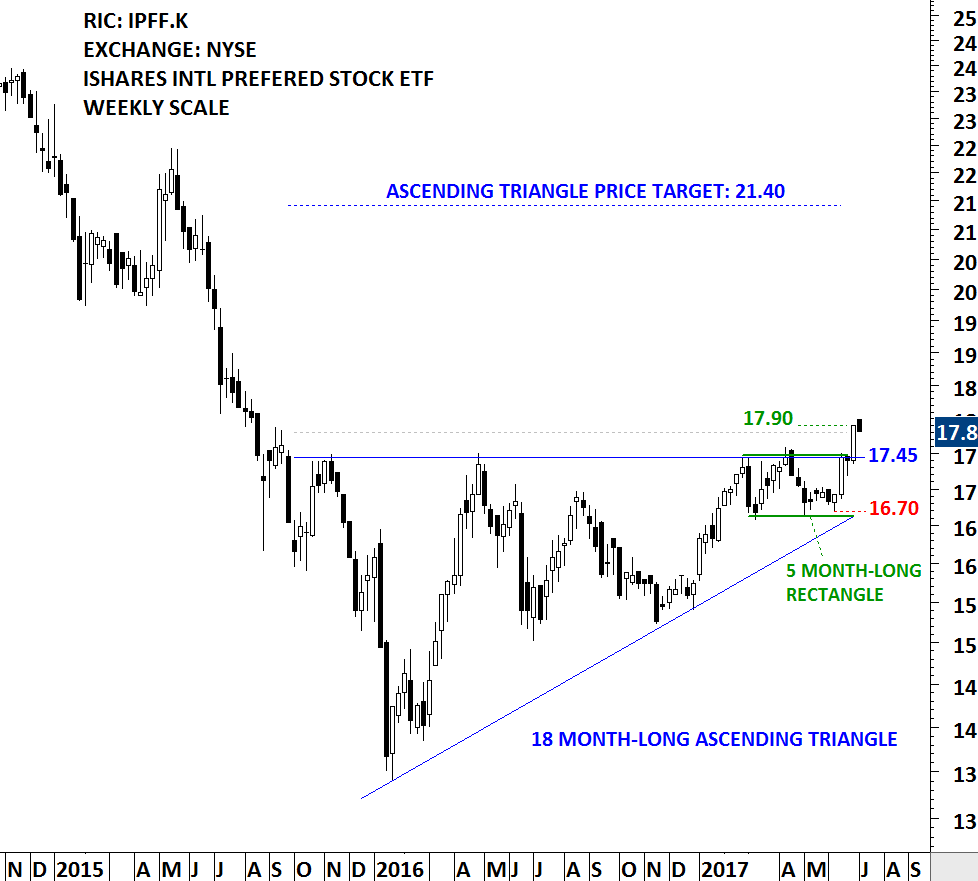
ISHARES INTL PREFERRED STOCK ETF (IPFF.K) formed an 18 month-long ascending triangle. IPFF.K has a well-defined horizontal resistance that was tested several times over the course of the chart pattern. Strong horizontal boundary stands at 17.45 levels. Last 5 month’s price action can be identified as a rectangle. The 5 month-long rectangle is acting as a launching pattern (learn more about launching patterns – Video Tutorial). The daily close above 17.80 levels confirmed the breakout from the multi-month ascending triangle with the possible price target of 21.40 levels.
Read more

GLOBAL EQUITY MARKETS – July 1, 2017

REVIEW


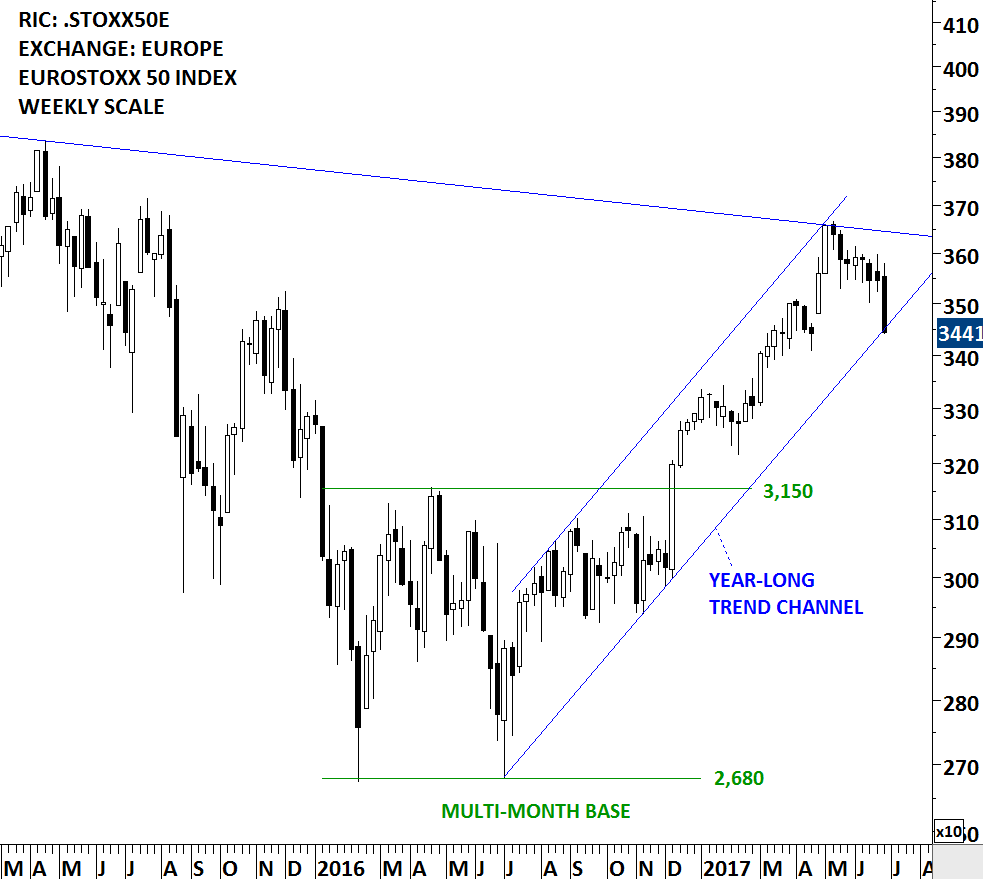
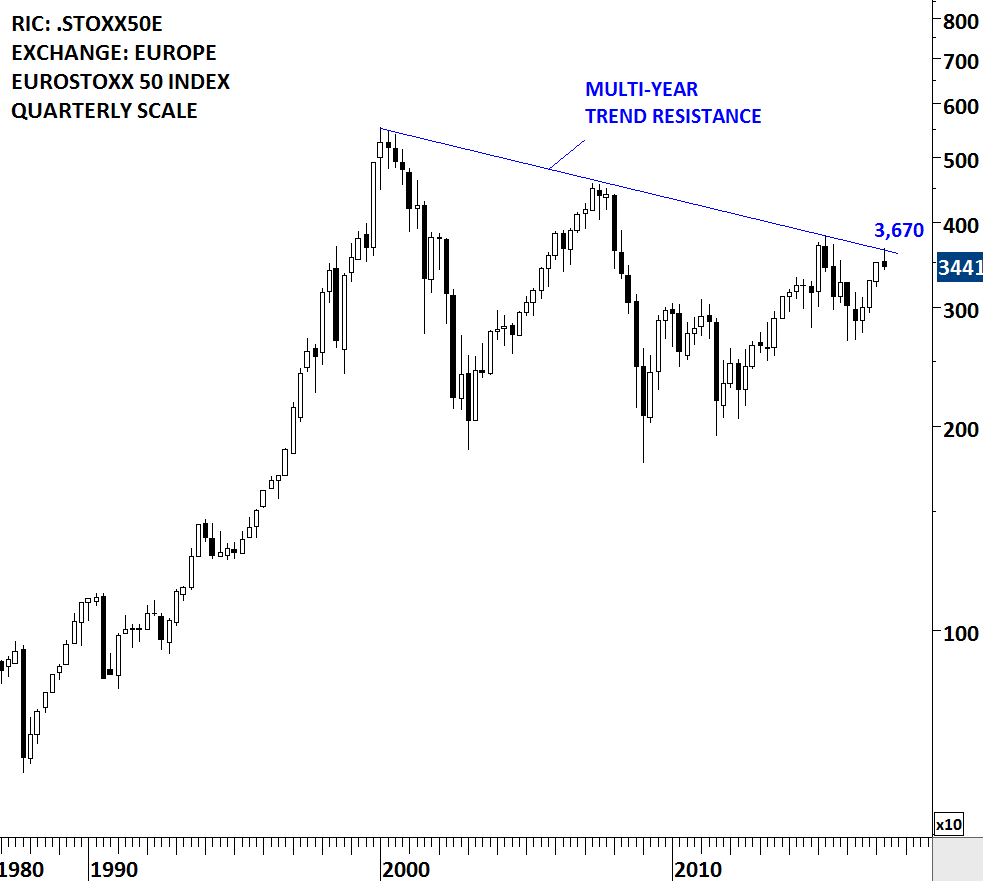
Europe’s equity benchmarks tested critical long-term resistances. After reversing from the multi-year trend line, Euro Stoxx 50 index pulled back to the lower boundary of its year-long trend channel. If the 2 month-long correction has run its course (still no sign of reversal), Europe’s equity benchmark can possibly rebound from the lower boundary of its trend channel. During May 2017 the index tested 3,670 levels and since then retreated towards the lower boundary of its year-long trend channel. Failure to hold at the lower boundary of the trend channel can extend the duration of the corrective period.

Read more

GLOBAL EQUITY MARKETS – June 24, 2017

REVIEW


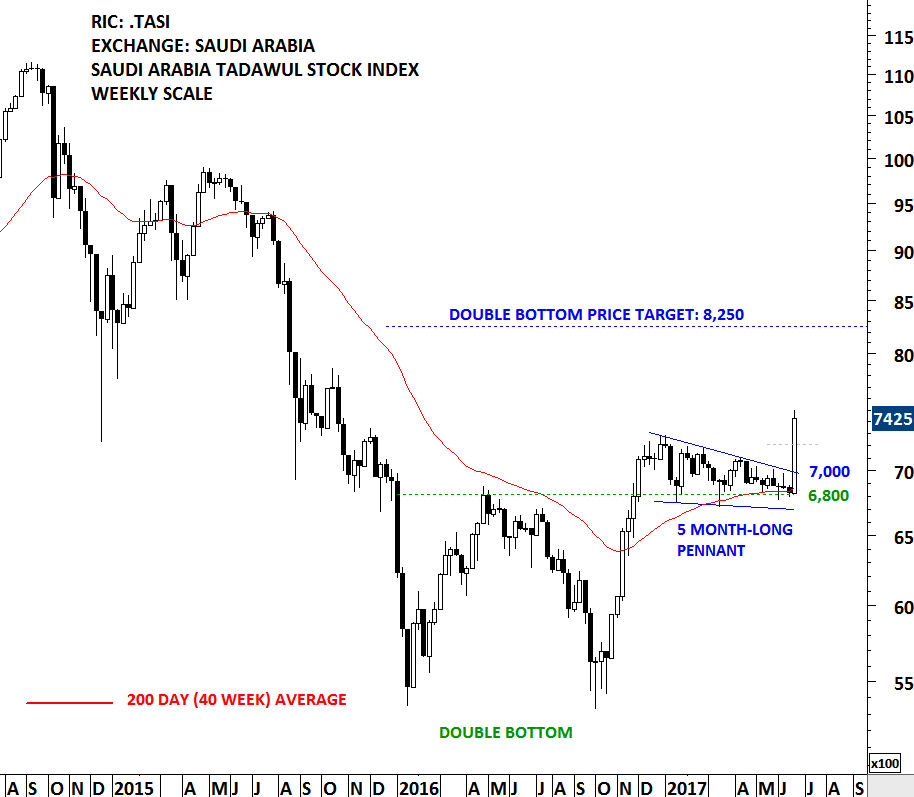
MSCI decision was the main driver for the strong performance of Saudi Arabia stock index during the week. (Read more on this) Strong price action cleared the 5 month-long pennant and resumed the uptrend towards the double bottom price target at 8,250 levels. Saudi Arabia’s positive chart pattern developments were discussed in the Interim Update June 19, 2017 and June 3, 2017 report. Double bottom is a bullish reversal chart pattern and pennant is a bullish continuation chart pattern.

Read more

INTERIM UPDATE – June 19, 2017

On June 20, global equity index compiler MSCI will announce whether it is putting Saudi Arabia on a list for possible upgrade to emerging market status. Index firm FTSE will decide in September whether to make Riyadh a secondary emerging market. In late 2018, authorities aim to list national oil giant Saudi Aramco in Riyadh, selling about 5 percent in what is likely to be the world’s biggest initial public offer of shares. Most fund managers think the index compiler is likely to put Riyadh on its review list on June 20. The actual decision on whether to include Saudi Arabia in MSCI’s emerging market index would then occur in mid 2018, and if MSCI follows past procedures, inclusion would occur in mid 2019.

There is an estimated 1.6 trillion USD tracking MSCI EM, as of the end of June 2016. The inclusion assessment is based on the MSCI Market Classification Framework described in the MSCI Global Investable Market Index methodology. For Emerging Markets, the classification depends on two criteria: (1) whether the equity market meets minimum size and liquidity requirements and (2) whether it exhibits accessibility levels for international investors that are sufficient in the context of Emerging Markets.

Read more

GLOBAL EQUITY MARKETS – June 17, 2017

Announcements:

1) New educational videos explaining the most analyzed 8 classical chart patterns are uploaded under the Educational Videos page. More videos are being prepared, featuring different outcomes for these chart patterns.

2) A new page featuring all the breakout alerts will be made available (next few days) for members. It will be a helpful tool for following up on the latest chart patterns, sort latest breakout alerts by date and search by ticker.

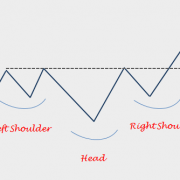
3) Due to high volume of requests from Tech Charts members, starting from this update I will add reference levels that would possibly negate a chart pattern. Other important labeling will be included on the charts. Below info graphic can be useful to explain the new additions on the charts.

Read more

INTERIM UPDATE – June 16, 2017

An interim update on some of the financial stocks might be valuable before the trading week ends. Over the past few weeks Tech Charts Global Equity Markets report drew attention to possible breakouts on Bank NY Mellon and Hartford Financial. Both stocks had strong breakouts from their multi-month long consolidation ranges and they are resuming their uptrends.

Read more

Descending Triangle – Bearish Continuation

You don’t have access to view this content

GLOBAL EQUITY MARKETS – June 10, 2017

UK election results, FANG (Facebook, Amazon, Netflix & Google) Volatility and U.S. Financial/Banking stocks strength. As much as I followed, these were the market moving topics of the week. It is important to note that U.K. FTSE 100 index broke out to all-time highs from its multi-decade long consolidation and the outlook remains positive in the long-term. Please see June 3, 2017 report for U.K. FTSE 100 Index chart.

Political/geopolitical events should not affect our chart interpretation. In fact, I believe that price action is primary and events are secondary. Price is a leading indicator. I am sure many of you experienced a breakout followed by a major news or event.

Read more