This update will cover several markets. There has been significant developments in the first half of January. I’ve given the title MSCI ALL COUNTRIES WORLD INDEX because I think it is one of the most important chart in this update. However, developments in Copper, Palladium and Emerging Markets index are also exciting. Over the past few weeks I’ve updated Tech Charts twitter followers on Copper, Palladium, Light Crude Oil, MSCI Emerging Markets index and some other chart patterns on equities. This will be an update for all followers.
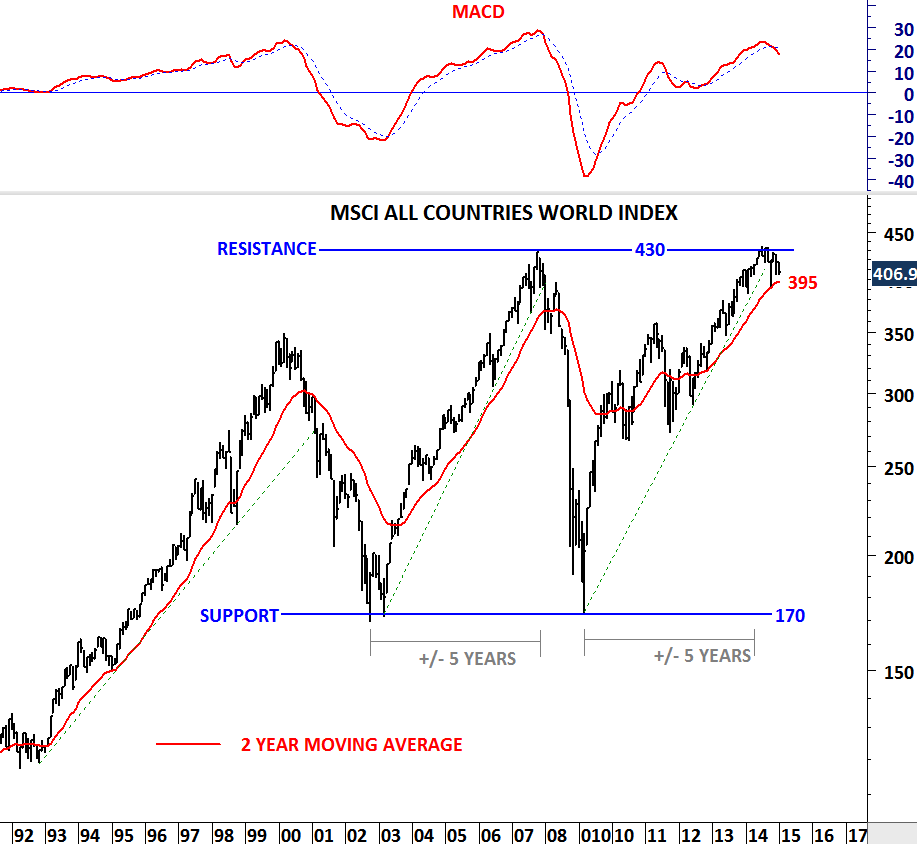
MSCI ALL COUNTRIES WORLD INDEX is at a critical juncture. Index covers more than 9000 securities in 46 different Developed and Emerging markets. I find it as a good representation of the global equity market performance. Attached is a monthly scale chart. MACD, which is a momentum and a trend following indicator generated a sell signal in November 2014. Cross-over on MACD is usually the first warning signal for a possible trend reversal. 2-year moving average which acted as a good trend following tool over the past decades is now at 395 levels. Breakdown below 392 (previous low in October 2014) will confirm the medium/long-term correction in global equities. We need to be prepared. This chart is at the top of my watch list.
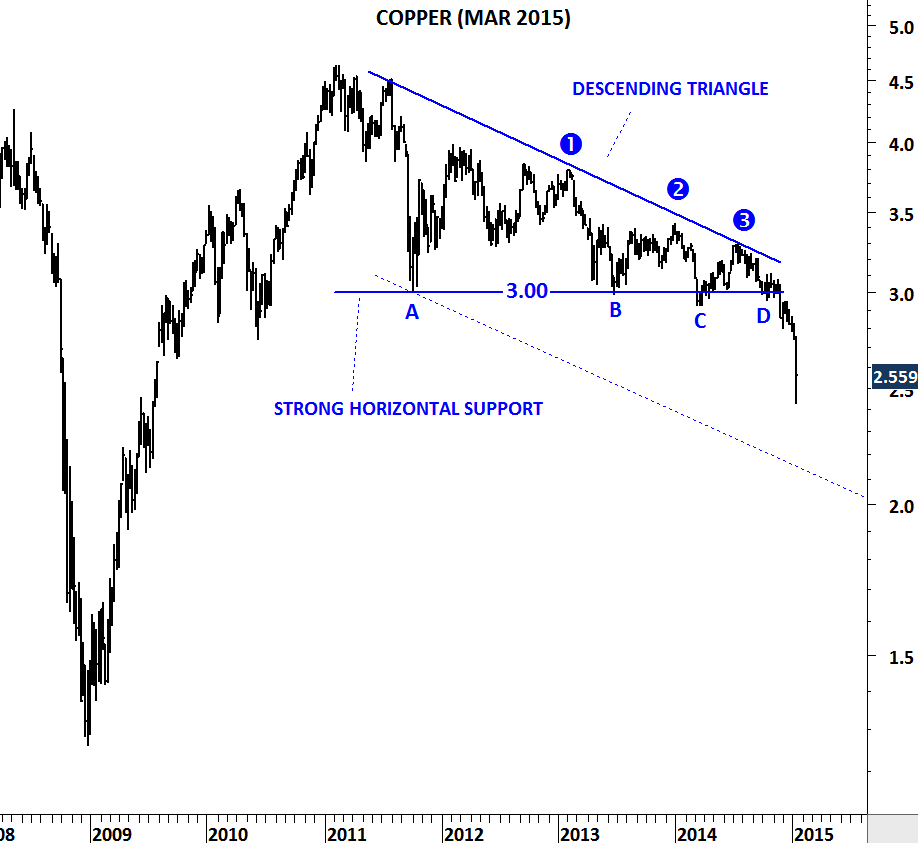
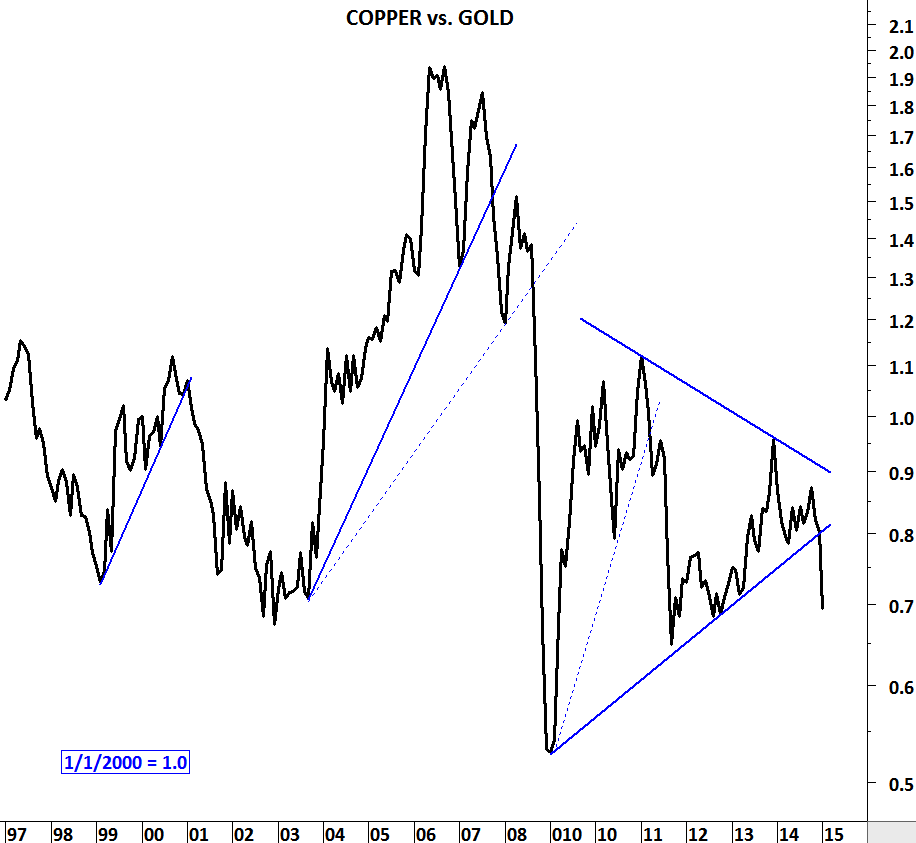
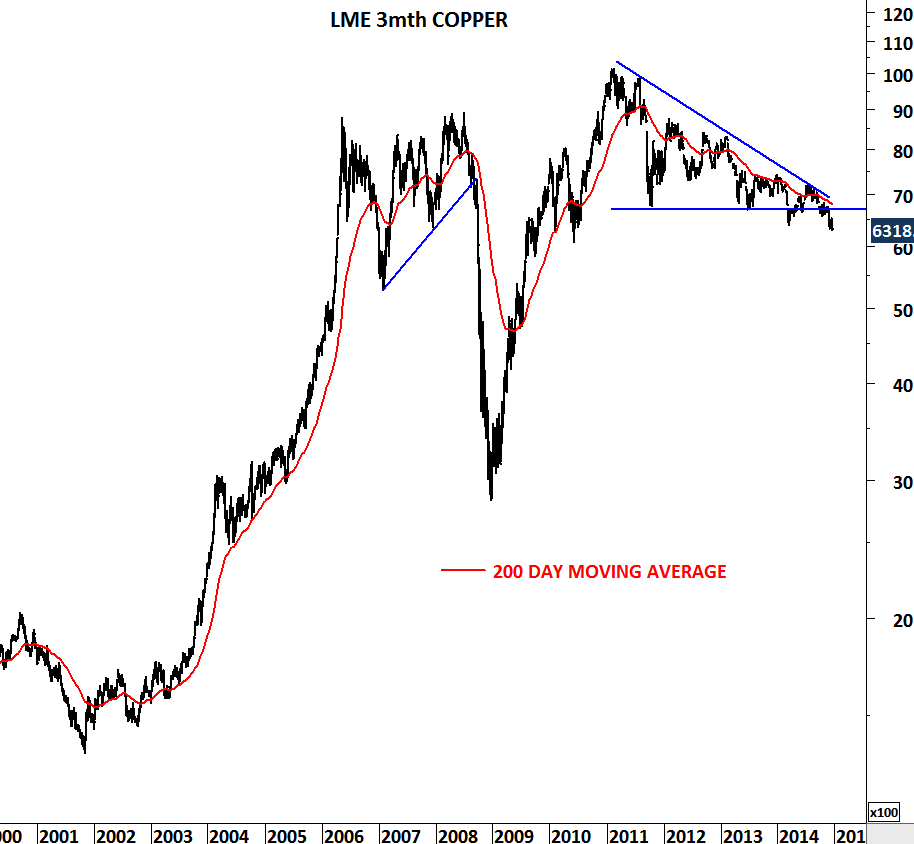
Dr. Copper warned us and I’ve sent several updates on this chart development. Weakness in Copper prices is negative for the global growth. Chart pattern (descending triangle) suggested lower prices below 3 levels. Breakdown was followed by an acceleration on the downside. Descending triangle price target is between 2.10-2.25. 2.10-2.25 area is also the lower boundary of the trend channel. Weakness can continue.
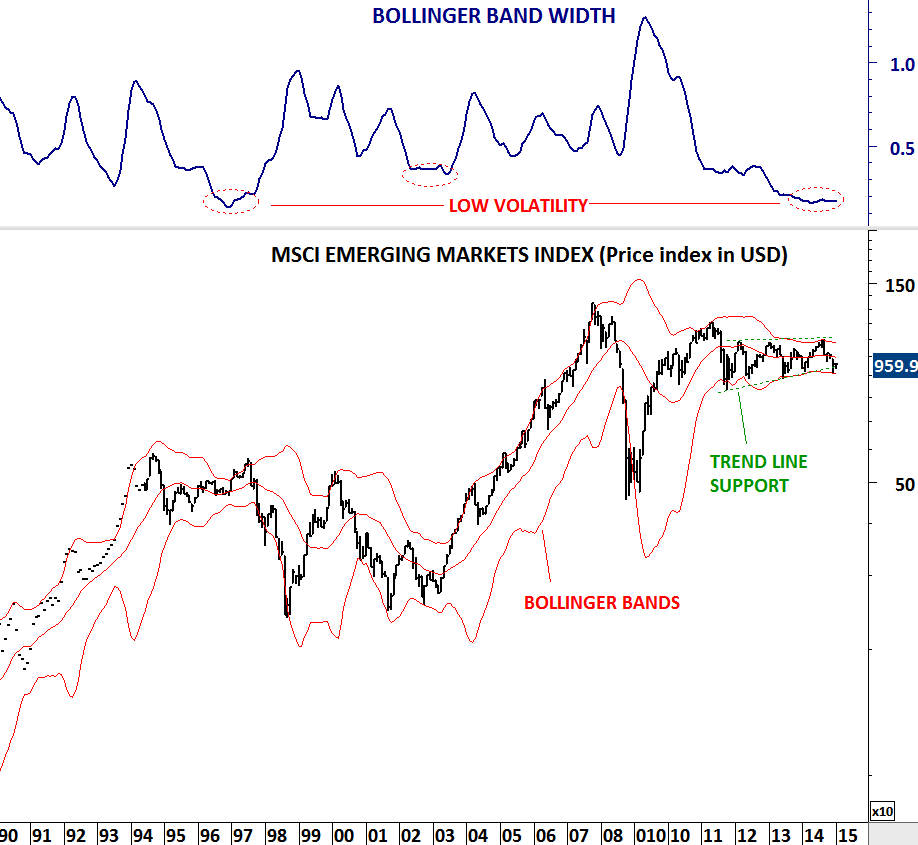
I study volatility on daily, weekly and monthly scale. A chart with low volatility on weekly and monthly scale is important for me. The longer the low volatility period, the better it is. Because that means there is a lot of energy built in that low volatile consolidation range and a a breakout is usually followed by a strong directional movement. This is the case for the MSCI Emerging Markets Index. Volatility reached multi-decade low levels on the monthly scale chart. A decisive monthly scale breakdown below 900 levels will push emerging markets to lower levels. This is a developing story and should also be watched closely.
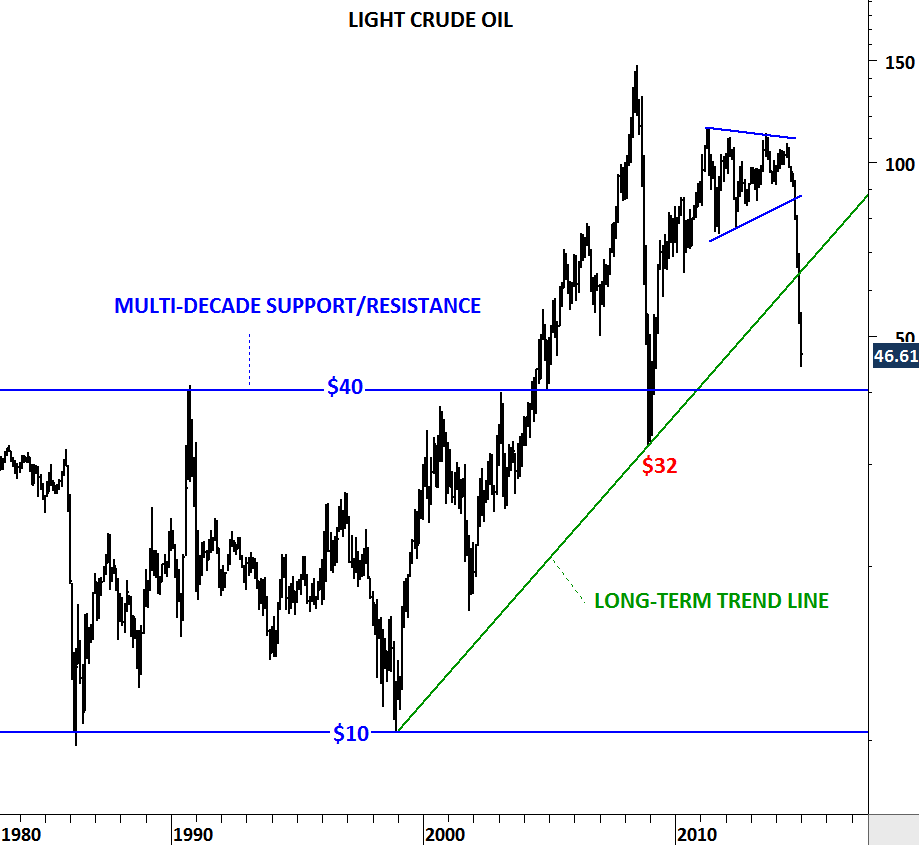
Mainstream media is talking about $40 oil price. Here is where that level is coming from. $40 is a long-term support/resistance level for the WTI Light Crude Oil. The important question is will it find support at that level? Well, for me the long-term chart is the best available information. In the past buyers/sellers appeared around $35-$40 area. I’ll expect the same. If we see a rebound, the next thing I will check will be how strong the rebound is. A weak rebound that hardly pushes the prices above $50 will signal further weakness for energy prices in the long-term.
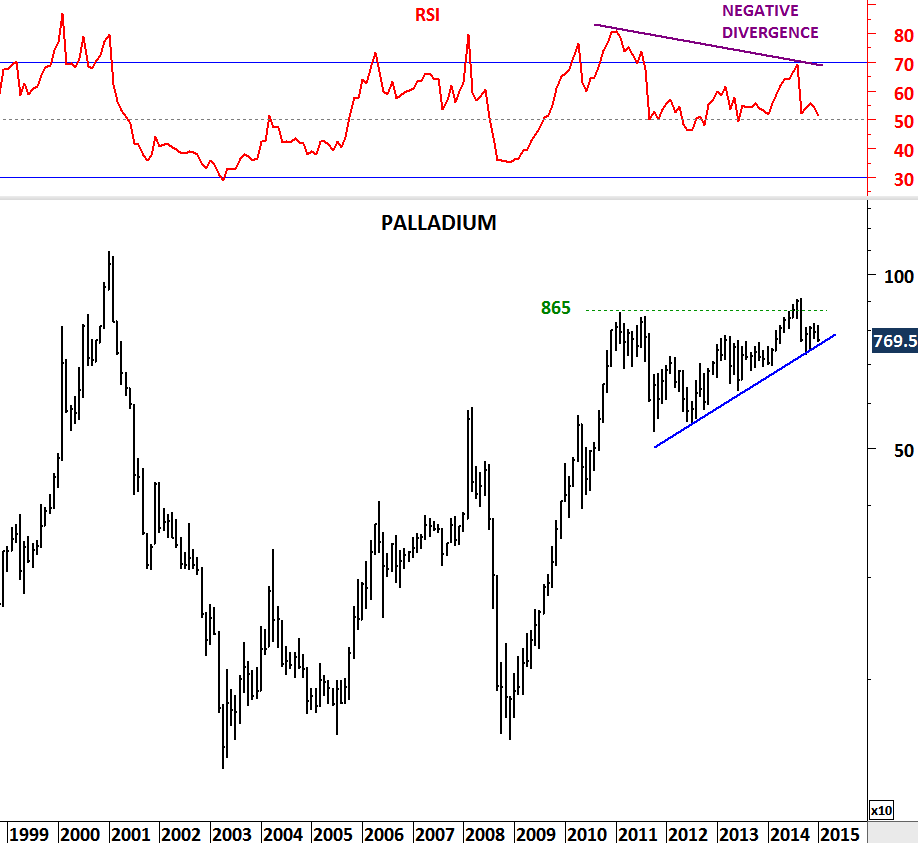
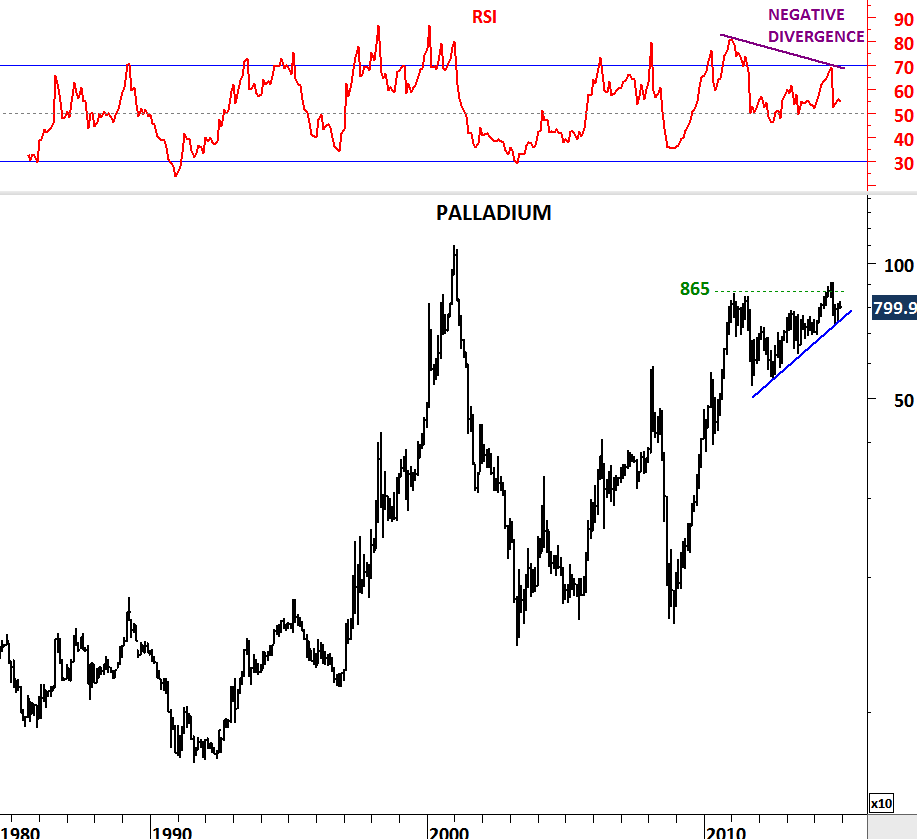
Last but not least, Palladium. I think the last 2 year’s uptrend has been extremely weak. Price tried to reach 2011 high level and it took 2 years for Palladium to reach that level with a major negative divergence on RSI on the monthly scale chart. October low stands at 725 levels. Breakdown below this level will send prices lower, possibly towards 500 levels.