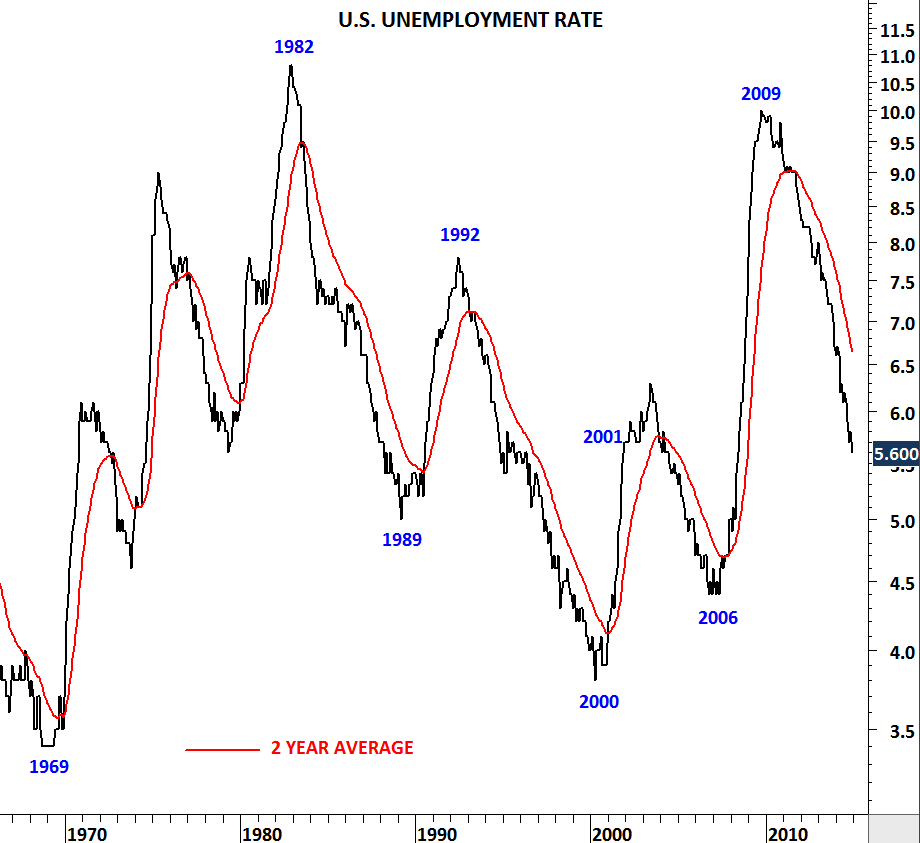
U.S. UNEMPLOYMENT RATE

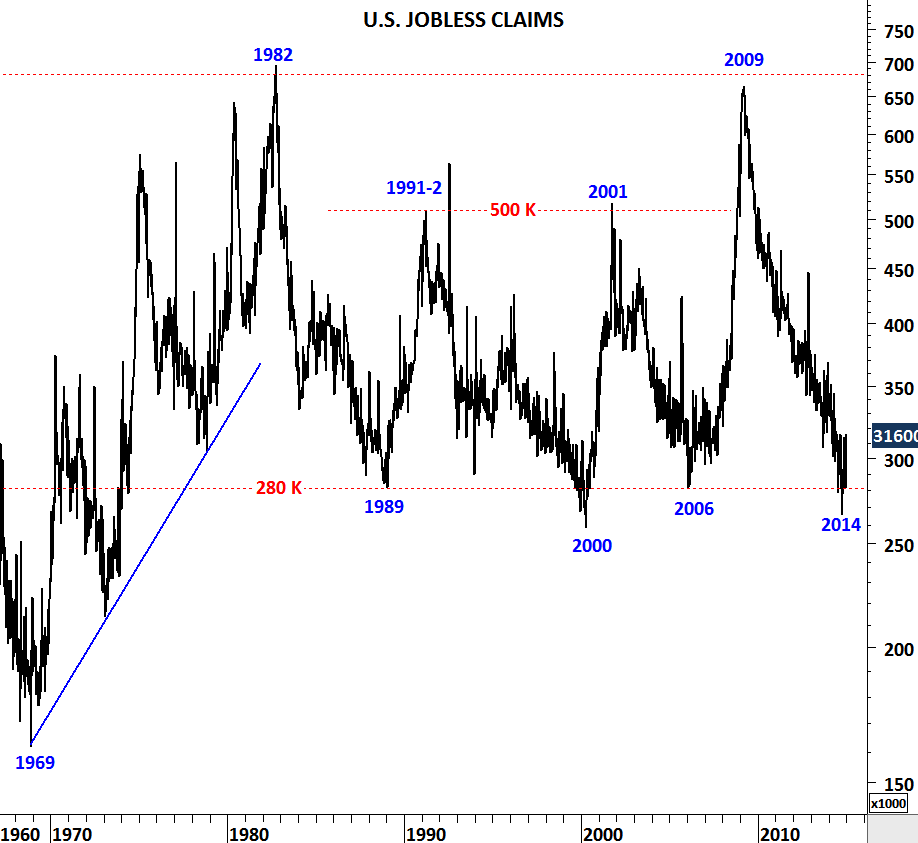
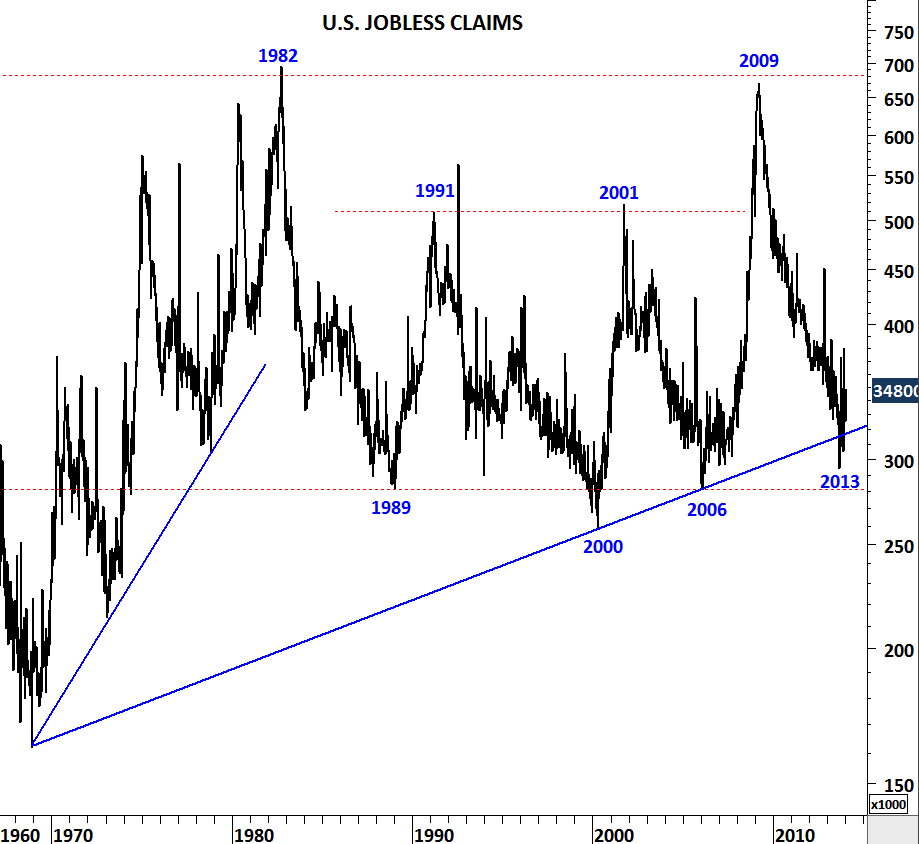
Two-decade long horizontal support at 280K on the U.S. weekly jobless claims chart suggest we might be at a “positive extreme” for the U.S. job market. 1989, 2000 and 2006 have proved to be the lowest levels for the weekly jobless claims. Reversals from 280K area resulted in a weak U.S. job market in the following years. Unemployment rate moved higher following the years 1989, 2000 and 2006. In 2014, U.S. weekly jobless claims reached as low as 266K. Latest data stand at 316K. Every long-term trend has an end. Historical levels on the long-term charts are warning us of a possible reversal. It is important to keep an eye on these two long-term charts in the following months.

US WEEKLY JOBLESS CLAIMS

US UNEMPLOYMENT RATE

U.S. HOUSING STARTS

U.S. housing starts was down another 9.3 percent in June after declining 7.3 percent in May. Latest figure stands at 893,000. Here is why we should actually pay close attention to 840,000 levels in the following months. Yes, technical analysis can also be applied to economic time series. Anything that is a product of human interaction in free markets is a subject of technical analysis and this historical chart on U.S. housing starts clearly shows the boundaries of the supply  and demand.

US HOUSING STARTS

Over the past half-century U.S. housing starts fluctuated between 2.2 million and 840,000 with one exception during the sub-prime mortgage crisis. Because the housing market was the epicenter of the financial melt-down during the 2007-2009 decline, housing starts data inevitably undershoot the 840K levels. Since October 2012, housing starts are above the historical threshold. For the housing market recovery to remain intact, housing starts should hold above 840K levels.

GERMANY BUND

Bond prices are rising again. German government bonds are looking strong as Bund futures prepare for a breakout from a 2 year-long consolidation range. Since mid-2012 German Bund has been consolidating between 137 and 147 levels. Prices are now testing the strong resistance at 147 levels for the 4th time. Breakout above 147 can result in a multi-month strength in German government bonds. Breakouts from flat consolidation ranges are powerful and are usually followed by trend periods.  Failure to close decisively above 147 levels can result in further consolidation between 137 and 147.

Monthly scale chart

BUND MONTHLY

Weekly scale chart

BUND WEEKLY

U.S. GOVT BONDS

Long-term base formations are powerful and breakouts from these chart patterns should be taken seriously. In April, the 30 year U.S. government bonds broke out of an inverse head and shoulder pattern. Breakout above 135.3 levels confirmed the bullish chart pattern which was followed by a pullback. Now we are seeing the continuation of the earlier strength.

Another bullish chart pattern, falling wedge is developing on the 10 year U.S. treasuries. Breakout above 126 levels will confirm the bullish chart pattern on the 10 year T-Note. Technical outlook remains positive for both instruments. (Earlier analysis on the U.S. governments bonds is here)

30 YR US TREASURY V US 10 YR T NOTES II

U.S. GOVT. BONDS

U.S. treasury and government bond prices are completing bullish chart patterns that could resolve on the upside in the following weeks. U.S. 30-year T Bond is completing an inverse head and shoulder base and the U.S. 10 year T Note is forming a falling wedge pattern. Both chart patterns are considered to be bullish and suggest higher prices in the short/medium-term. Breakout above 135.3 levels will confirm the inverted head and shoulder on the 30-year T Bond price chart and breakout above 126 levels will confirm the falling wedge on the 10-year T Note.

US 30 YR BONDS

US 10 YR T NOTES

U.S. UNEMPLOYMENT

U.S. ADP January payroll change smallest since August at 175,000. U.S. employment increased by 175K private sector jobs in January. Data updated on a monthly basis.

Thursday: U.S. weekly jobless claims data. Data updated on a weekly basis.

These two data series become more important as FED starts tapering program. U.S. weekly jobless claims and ADP Employment (total nonfarm private employment) reached strong support levels; in other words overstretched levels from historical perspective. Any data point going forward could be worse than expected. Historically medium/long-term reversals took place around these levels. By looking at these long-term charts on the economic time series, I believe the FED will not be aggressive in their tapering program in the following months. Any spike on the U.S. weekly jobless claims or worse than expected numbers on the ADP employment could weaken the case for further tapering.

ADP EMPLOYMENT

US JOBLESS CLAIMS