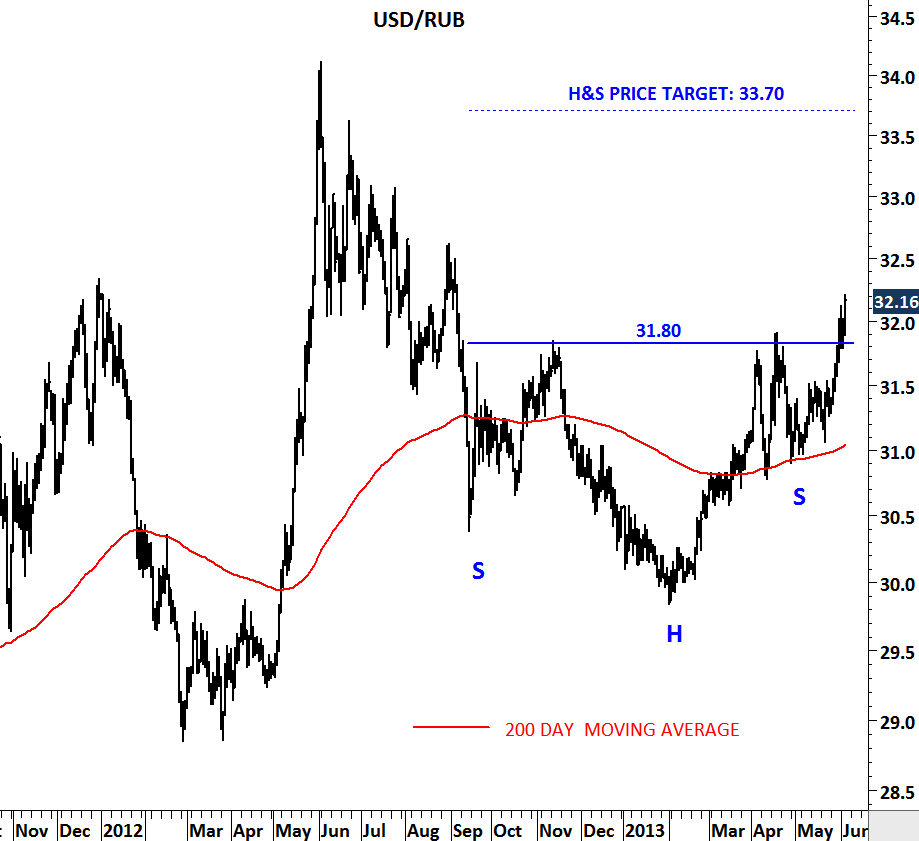
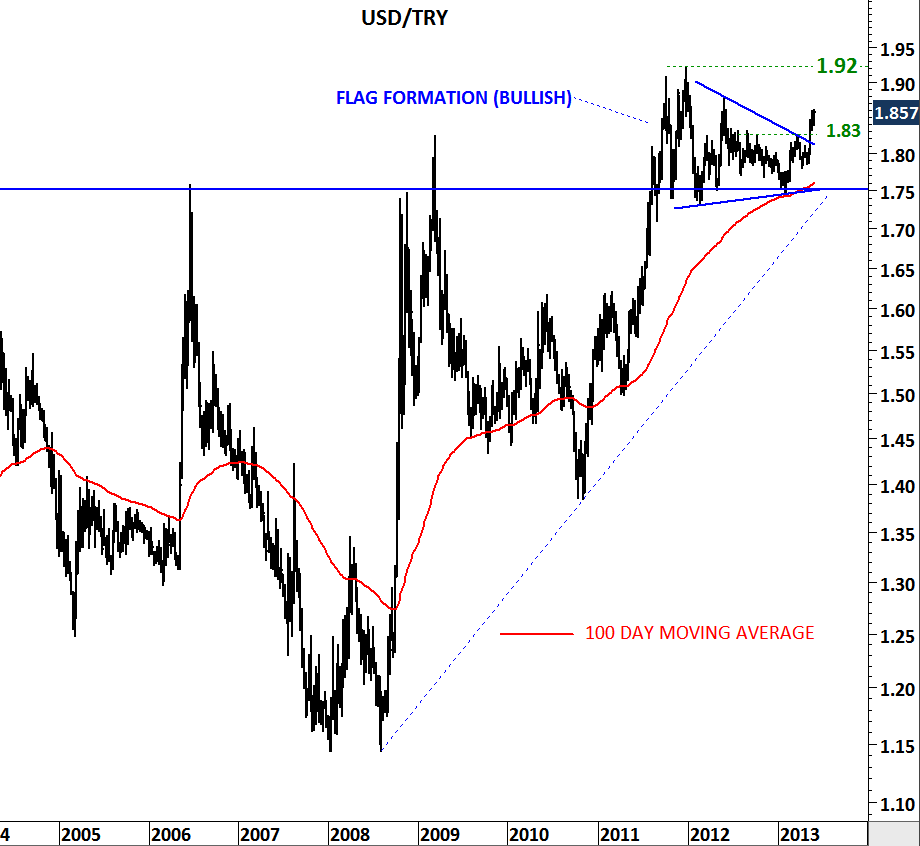
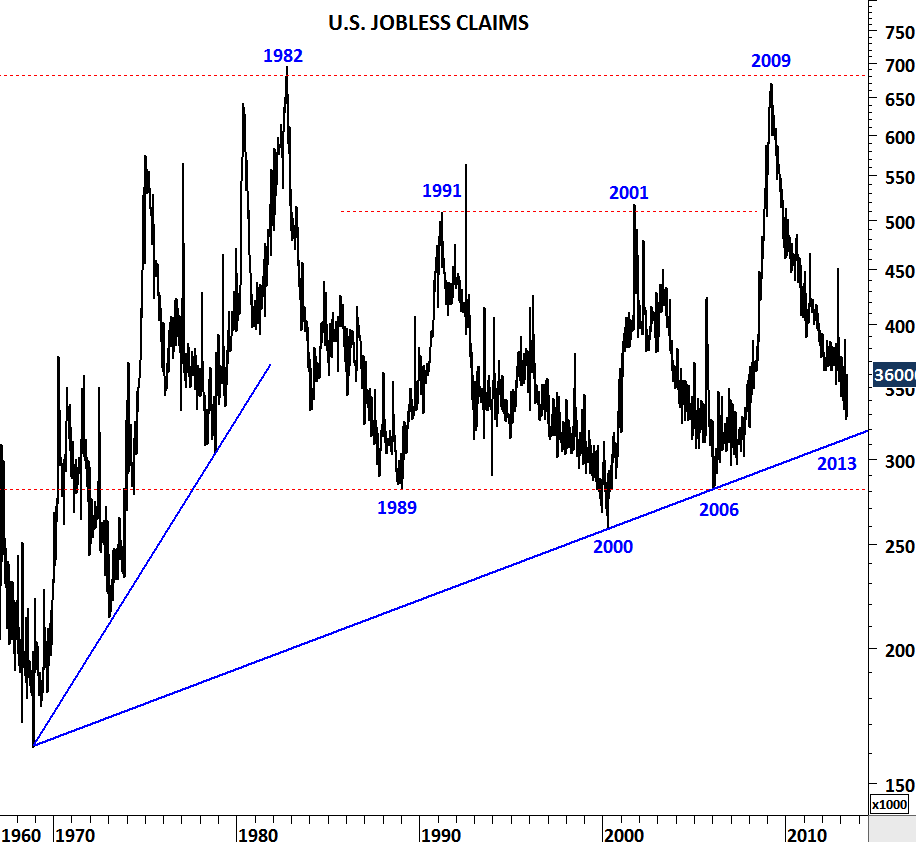
USD/TRY

USDTRY

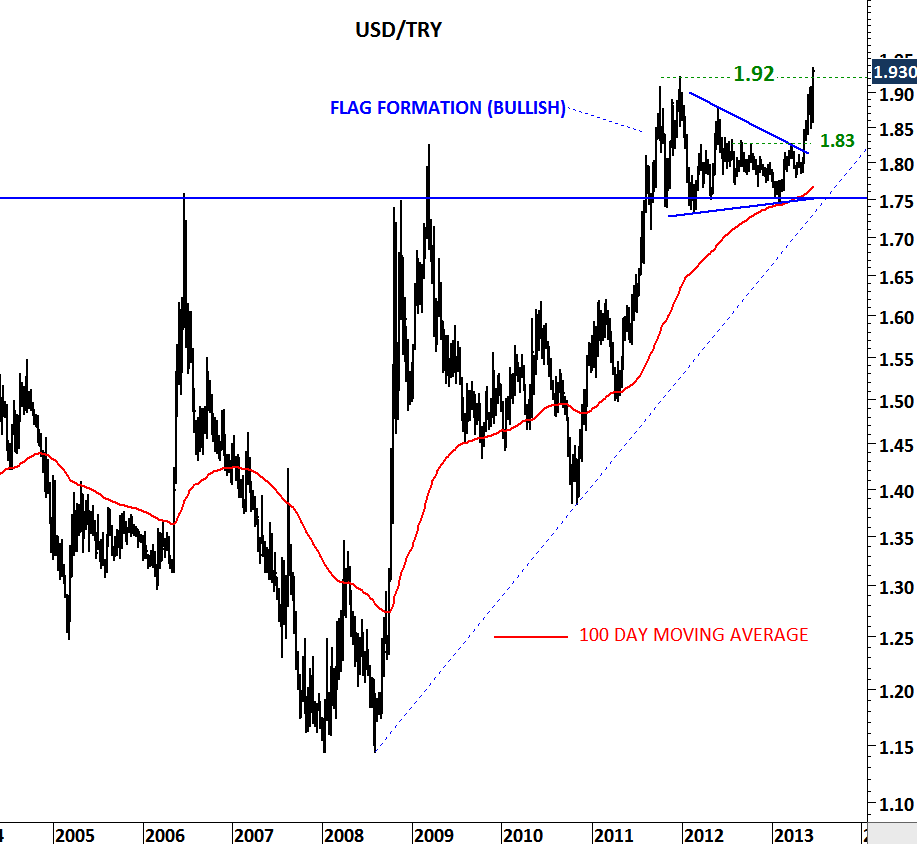
It is uncharted territory once again for the USD/TRY. For more than a decade USD/TRY (U.S. dollar/Turkish lira) consolidated between 1.75 and 1.15 levels. Cross rate managed to stabilize for more than a decade after the inflationary years of 1990s. It was mid-2011 when the USD/TRY breached the decade-long resistance at 1.75 levels. First the cross rate reached 1.92 levels and then pulled back to 1.75. Short/medium-term consolidation formed a bullish flag and in May we have discussed the possibility of a strong breakout. Breakout above 1.83 was followed by a sharp upward move. Emerging market currencies are weakening against the U.S. dollar. Turkish lira is one of them. Price, breaking to a new all time high increases the risk of further depreciation towards 2.0 levels. Medium-term stop-loss area becomes 1.75-1.83. With the medium-term stop-loss area in place, we can expect higher USD/TRY in the following weeks.

XU30 INDEX – (TURKEY)

XU30

It’s been an eventful month so far in Istanbul. Anti-government protests resulted in a sharp sell-off in Borsa Istanbul. Protests can continue for sometime and markets can stay volatile. While it is difficult to understand the price action during these type of event-driven markets, support/resistance levels could be helpful in managing risk. XU 30 index slipped below its long-term (200 day) average at 97,200. This was also the lower boundary of the upward trend channel. Failure to push above the long-term average will be a clear sign of weakness and could result in further downward pressure towards 76,000-91,500 range. The uptrend that has been intact since the beginning of 2012 is damaged and for us to discuss positive price action and improving technical outlook, the index should breach above 97,200 levels in the following weeks.

WTI CRUDE OIL

WTI CRUDE OIL

We are likely to see a strong breakout on crude oil in the following days/weeks. Strong resistance is at $97 levels. Downward sloping trend line which acts as strong resistance was tested for five times over the past one year. Breakout from the short/medium-term symmetrical triangle will push prices higher towards $104. This is one of the important charts to follow in the following days/weeks.

U.S. JOBLESS CLAIMS

US JOBLESS CLAIMS

US UNEMPLOYMENT RATE

Today we will update our jobless claims data. Since 2009, U.S. jobless claims have been declining from 650K levels to 350K. This has been a strong downtrend and reached levels that proved to be major support over the past decades. 300-350 area is strong support. Higher jobless claims data over the next few months could signal a major turning point that could result in weak job market. Currently unemployment rate stands at 7.5%.

USD/RUB (U.S. DOLLAR/RUSSIAN RUBLE)

USDRUB

Russian ruble is another emerging market currency that has lost ground against the U.S. dollar. Over the past 9 months cross rate completed an inverted head and shoulder pattern with the neckline acting as resistance at 31.80 levels. Inverted head shoulder is regarded as a bullish reversal pattern. We are now seeing USD/RUB breaking above the resistance at 31.80 levels. With a stop-loss slightly below 31.80 we should follow this cross rate to move higher favoring U.S. dollar. Inverted head and shoulder price target will be 33.70 in the medium-term.

USD/ZAR

USDZAR

U.S. dollar continues to gain strength against major emerging market currencies. In this update I’m analyzing the USD/ZAR (South African Rand). USD has been strong against the Rand since mid-2011. We are now seeing the uptrend accelerating towards the long-term resistance at 10.70 levels. Earlier tops in 2001 and in 2008 was marked with an upward spike. 10.70 is the likely short-term target.

USD/INR & USD/TRY

Earlier in May I’ve updated two charts on the emerging market currencies USD/INR (Indian Rupee) and USD/TRY (Turkish Lira). Both suggested strong USD in the short/medium-term. We are seeing clear breakouts from consolidation ranges and weakness in major emerging market currencies.

USDINR III

USDTRY II

U.S. JOBLESS CLAIMS

US JOBLESS CLAIMS II

U.S. jobless claims spiked higher in the May 11 week, up 32,000 reaching 360,000. Earlier analysis showed a long-term chart of the weekly jobless claims, reaching strong support levels. Over the past 4 years jobless claims moved from one extreme to another.

EUR/USD

EURUSD

Many people must have seen the latest H&S chart pattern on the EUR/USD. If you haven’t seen it above is the price chart of the EUR/USD with its 200 day simple moving average. H&S patterns do fail. Reversal above the right shoulder (1.33 level) would result in a failed H&S pattern. If there is no failure then there will be a confirmation of the H&S pattern by a breakout above or below the neckline; in this case 1.2750. It is clear that there is weakness in the euro. Or in other words strength in U.S. dollar against major currencies. Weakness in EUR can continue in the following days. Breakdown below 1.2750 will confirm the head and shoulder chart pattern and will set a price target of 1.20 levels. If EUR/USD reverses from these levels and breaches 1.33 on the upside, then the target in the following weeks becomes 1.37.

USD/INR (U.S. DOLLAR/INDIAN RUPEE)

USDINR II

Another emerging market currency that is weakening against the U.S. dollar is Indian rupee. Recent update on the 7th of May drew attention to the possibility of a strong breakout from the low volatility period. USD/INR is now close to 55 levels; last minor resistance before the cross rate targets 56-58 area. Technical outlook is bullish for the U.S. dollar.