USD/INR (U.S. DOLLAR/INDIAN RUPEE)

USDINR

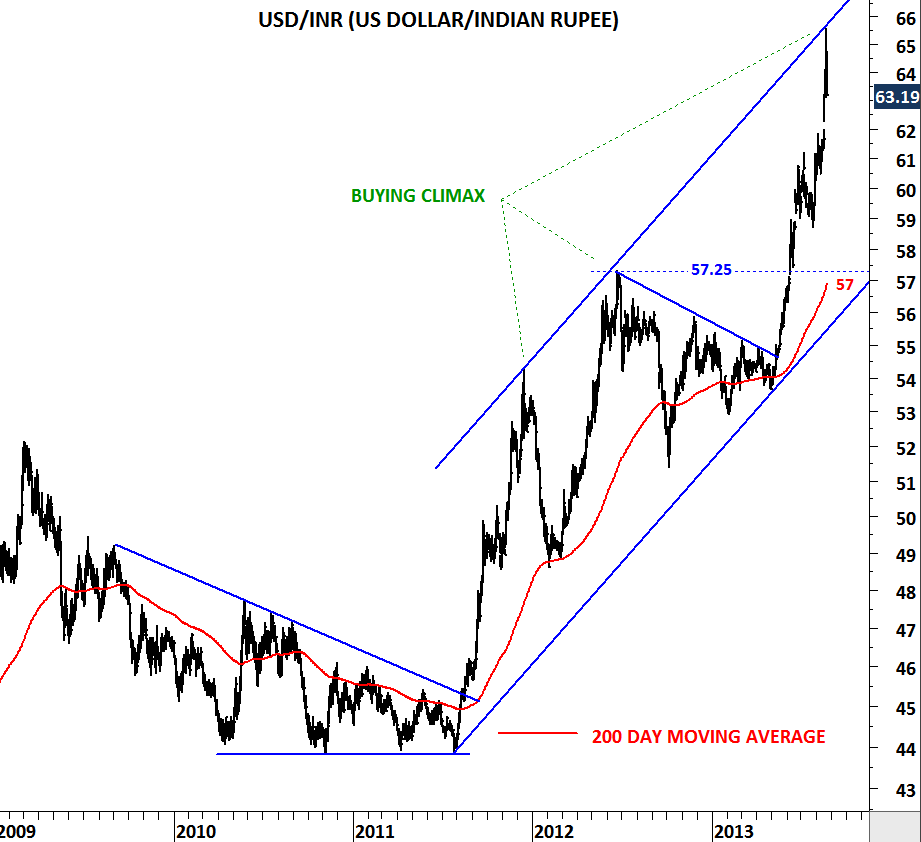
Earlier in May, Tech Charts blog followers read three different updates on the USD/INR suggesting strong U.S. dollar versus the Rupee (May 7, May 13, May 28). Since then the cross rate had a strong breakout and entered into a parabolic upward move. Over the past month price reached a strong trend channel resistance between 65 and 66 levels. Parabolic moves are usually followed by sharp setbacks. The latest rally may near completion with a buying climax similar to previous sharp rises in 2011 and 2012. Uptrend is over extended and we can see stabilization and consolidation between 60 and 66 levels.

(THAILAND) SET INDEX & (TURKEY) BIST 30 INDEX

BIST 30 II

THAILAND SET INDEX III

Emerging markets are taking a hit with their bond, currency and equity markets. We are seeing clear technical damages on mainly emerging asia and the rest of the emerging markets. Two equity indices that show similarities are Thailand’s SET index and Turkey’s BIST 30 index. Both indices had strong uptrend between 2009 and 2013. They were the best performing markets. Though this might be ending soon. Both SET index and BIST 30 breached strong long-term trend supports. They are clearly below their 200 day moving averages and downward momentum is picking up over the past few days. On both indices MACD generated sell signals below 0 level. Technical outlook is negative.

What would change the outlook back to neutral/positive? Turkey’s BIST 30 index should climb back above its 200 day moving average at 95K and Thailand SET index above 1,450. Before that happens we follow these two markets with a negative outlook.

S&P GSCI (Commodity Index)

S&P GSCI II

Commodities have clearly underperformed equities over the past two years. This is due to correction in metals, already weak agricultural commodities and relatively quiet energy prices. None of the commodity index components had a strong enough trend to force the S&P GSCI out of its consolidation range, though signs show that this might be changing. Low volatility on the commodity index suggests a strong trend period should follow in the next few months. Breakout above 655 will be extremely bullish for the commodities – likely to put an end to the two-year sideways consolidation. Breakdown below 600 levels will result in a downward trend and target 500-550 area in a short period of time.

U.S. JOBLESS CLAIMS

US JOBLESS CLAIMS

Year 2013 could mark the medium/long-term low for the U.S. weekly jobless claims. Over the past 4 years, jobless claims trended lower from 680K levels to 330K levels. This is a significant improvement given the magnitude of the historical swings on this economic time series data. U.S. weekly jobless claims reached an important trend support and if this trend line acts as support as it did in 2000 and 2006, we should expect higher levels in the last quarter of the year. Breakdown below this trend line at 320K levels could help the jobless claims ease towards the horizontal support at 280K.

COCOA (SEP3)

COCOA I COCOA II

Cocoa prices might be forming a short/medium-term base at the long-term trend channel support. Cocoa had sharp and wide swings over the past decade. The uptrend remained intact as it can be seen from the upward sloping trend channel. In the beginning of 2011, price reversed from the upper boundary of the trend channel at 4,000 levels and reached the lower boundary at 2,000. Since then the soft commodity has been consolidating above the long-term trend channel support. With this week’s breakout above 2,400 levels Cocoa might be forming a cup & handle chart pattern, usually regarded as a bullish chart formation that could target 2,800 levels. In the short-term technical outlook on Cocoa turns positive. As long as price remains above 2,400 levels, the soft commodity will have an upward bias.

S&P GSCI (COMMODITY INDEX)

S&P GSCI

S&P GSCI (Commodity Index) is in a clear downtrend. Well-defined downward sloping trend line acts as strong resistance at 655 levels. Over the past two years trend line acted as strong resistance and each counter trend reaction reversed from the strong trend resistance. It is now clear that a breakout above this technical level will reverse the medium/long-term downtrend. I continue to watch commodities with a negative technical outlook but also keep a close eye on this strong trend resistance in case we see a sharp reversal and a decisive breakout above 655 levels.

TURKEY 10 YEAR BOND YIELD

TURKEY 10 YEAR BOND YIELD I

TURKEY 10 YEAR BOND YIELD II

May 2013 recorded the low for the Turkish 10 year government bond yields. Year-long downtrend was reversed with the breakout above 7.2 levels. Yields broke above 1) downward sloping trend line at 7.0 2) flat horizontal resistance at 7.2 and 3) 200-day moving average at 7.1. Sharp rally carried the yields to 9.5 levels. Since the beginning of July, 9.5 has been short-term resistance. However, chart formation (ascending triangle) suggests higher yields towards 10.5 levels unless we see a breakdown below 8.6 levels in the coming days/weeks. For the time being 10 year bond yields are in a short-term consolidation. Technical outlook is positive for the yields and negative for the bonds, as the 10 year yield established its uptrend above the 200-day moving average. During any pull back strong 7.60-8.60 area will act as strong support. Breakout above 9.5 levels will target 10.5 in the short-term.

THAILAND SET INDEX

THAILAND SET INDEX

USDTHB

Emerging market equities are challenging their long-term moving averages. Breakdown below these critical long-term support levels could result in sharp corrections. Since the first quarter of 2013 we have seen weakness in emerging market currencies and their equity indices. Thailand was one of the best performing emerging market over the past 4 years. Though a correction could be as sharp as the upward trend. SET Index is now testing the 4 year-long trend line support and the 200-day moving average. Breakdown below these strong support levels could result in a deep correction towards 1,100 levels. USD/THB is already off its lows and well above its 200-day average. Strong support area for the USD/THB is between 30.4 and 30.8. Current technical outlook is negative for Thai Baht and the Thailand SET Index. Unless the equity index recovers above 1,500 levels, downward pressure will remain intact.

XU 30 INDEX – (TURKEY)

BIST 30

Is this a base formation or a short-term consolidation before the major break down and the resumption of the downtrend? Turkey’s XU 30 Index is holding above its 5 year-long uptrend and a break below 85K could turn into a sharp correction. Latest consolidation below the 200 day moving average has been weak and the counter trend moves had difficulty to close the gap between 100K and 105K. It is important to note that the index is testing its long-term trend for the 4th time over the analyzed period and a breakdown below this strong support will signal further downward pressure. Technical outlook would turn bullish only if the index recovers above 95K levels which is the 200 day moving average.

USD/MYR (U.S. DOLLAR/MALAYSIAN RINGGIT)

USDMYR

After a long break on markets (as I have been enjoying being a father for the first time) I’m back with a blog update on an exciting range breakout in the emerging asia currencies. USD/MYR is trying to breakout from a 2 year-long consolidation range. This pair has been on my watch list for some time. I like these type of flat range breakouts. In this example USD/MYR moved between 3.00 and 3.20 levels for almost two years and over the same time period the crossrate tested 3.20 levels for 4 times. We can see that with this week’s price action, USD/MYR is challenging the same resistance. A decisive weekly close above 3.20 will confirm the breakout and push the crossrate towards 3.30-3.35 area. For the bullish outlook to remain intact USD/MYR should hold above 3.20 levels in the following weeks.