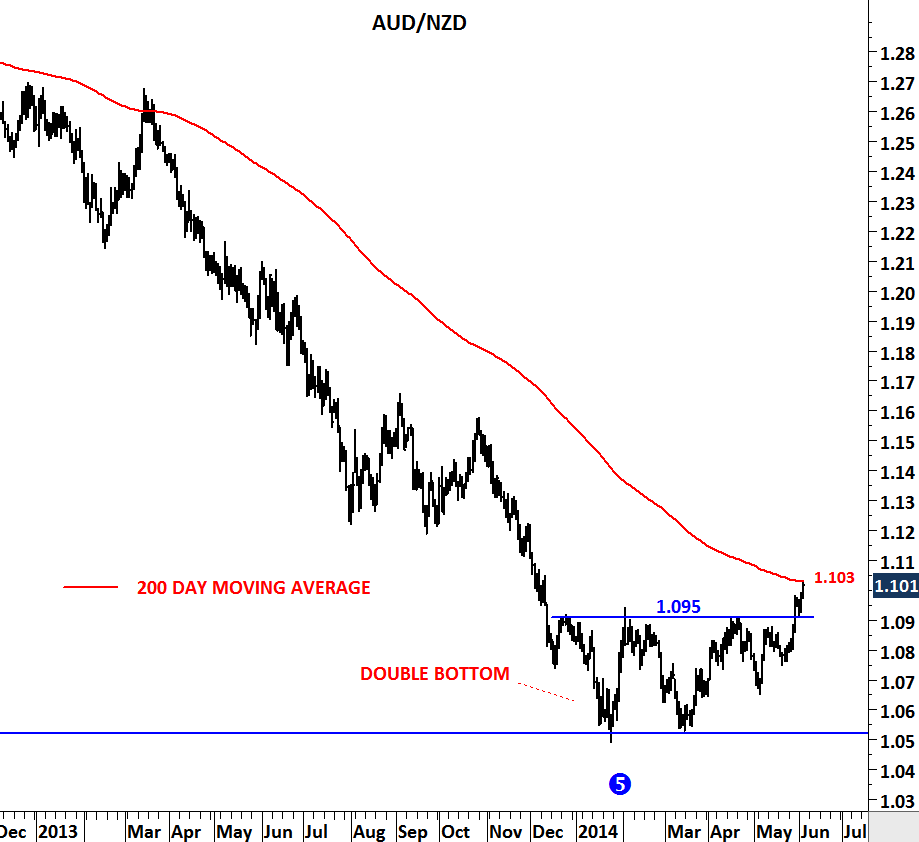
AUD/NZD
I analyzed this pair in April 2014. Cross rate showed significant chart pattern development at a historical support. AUD/NZD is trying to rebound from 3 decade-long support level. 1.05 was tested for five times over the past thirty years. Each test was recorded as medium/long-term low. We are there again… Not only the long-term chart is signaling a possible rebound but also the daily chart is suggesting higher AUD/NZD with a double bottom chart pattern.
- On the long-term monthly scale chart MACD is trying to reverse from a historical low-level. Buy signal on MACD will be bullish for Australian dollar.
- On the daily chart AUD/NZD breached the horizontal resistance at 1.095. Last challenge is the 200-day moving average at 1.103 levels.
I think the overall technical outlook is turning in favor of Australian dollar versus New Zealand dollar.
Monthly scale chart
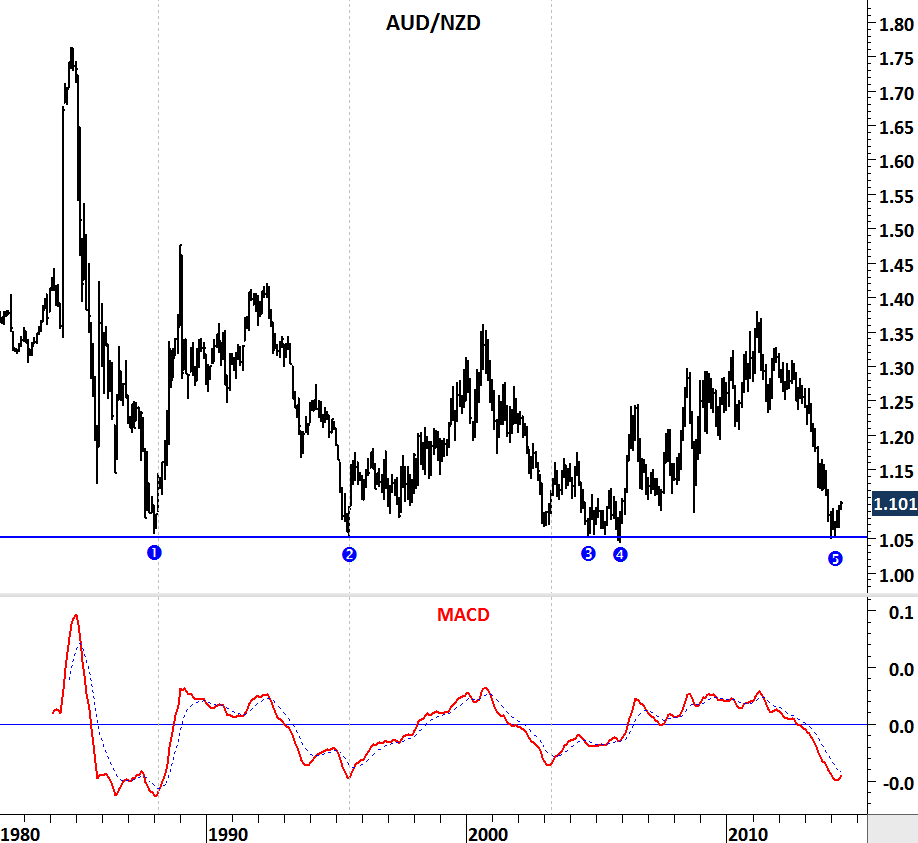
Daily scale chart