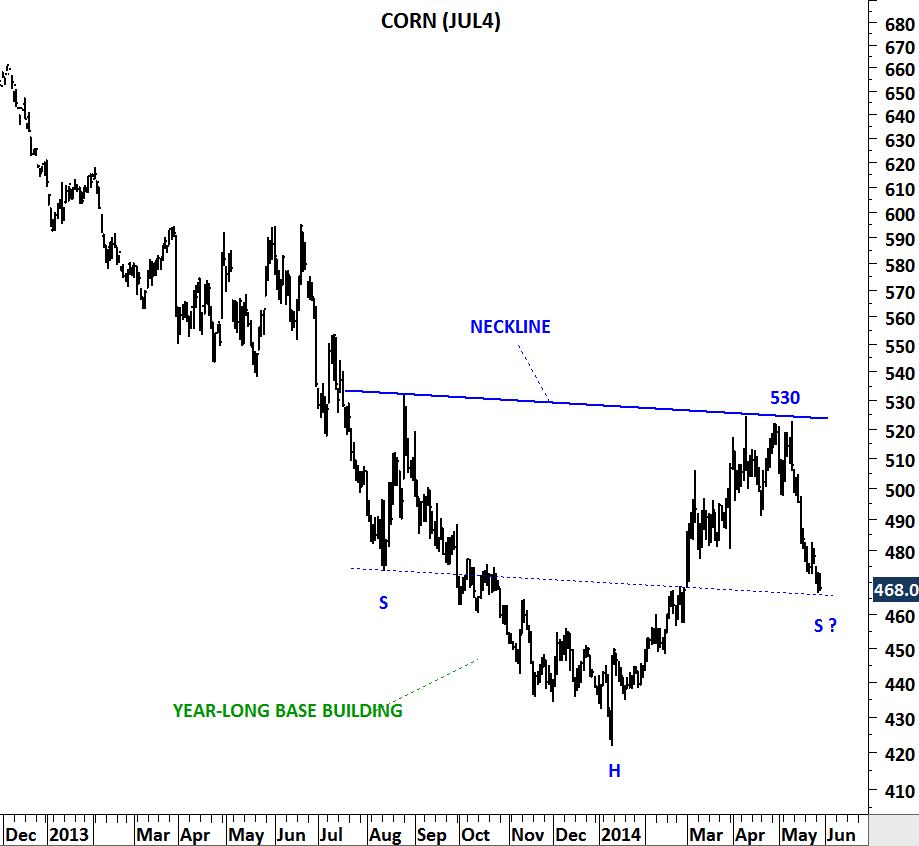
CORN
Is Corn forming a perfect inverted head and shoulder chart pattern? If yes, price should rally from these levels and reach the neckline around 530 levels in the next few weeks and if you see such price action you should be more confident that a year-long base formation is about to complete, suggesting much higher levels. I like to see symmetry in head and shoulder chart patterns and also a horizontal neckline. So far the chart pattern followed these characteristics. We are probably still at the early stages but it’s worth adding this chart to our watch list as a bullish chart development.