GLOBAL EQUITY MARKETS-21/01/2017
Every week I post the latest additions to the #TECHCHARTSWATCHLIST. Stocks that qualify to the watch list are those that have well-defined and mature chart patterns that are likely to resolve in a strong directional movement. Stocks that breakout from those well-defined chart patterns are brought to your attention under the #TECHCHARTSALERT. Both the watch list and the alerts are covered in this weekly update. As usual there are several great chart setups in this week’s update both from Developed and Emerging markets.
#TECHCHARTSWATCHLIST
DICKERDATA FPO (DDR.AX)
DICKER DATA LTD. is a small cap technology company listed on the Australian Stock Exchange. The company is engaged in the wholesale distribution of computer hardware, software and related products. Price chart of DICKERDATA formed a 4 month-long rectangle. This week’s price action pushed the stock from the lower boundary of its range to the upper boundary. A daily close above 2.47 will confirm the breakout from the bullish continuation chart pattern. Breakout will also push the stock to all-time high levels.
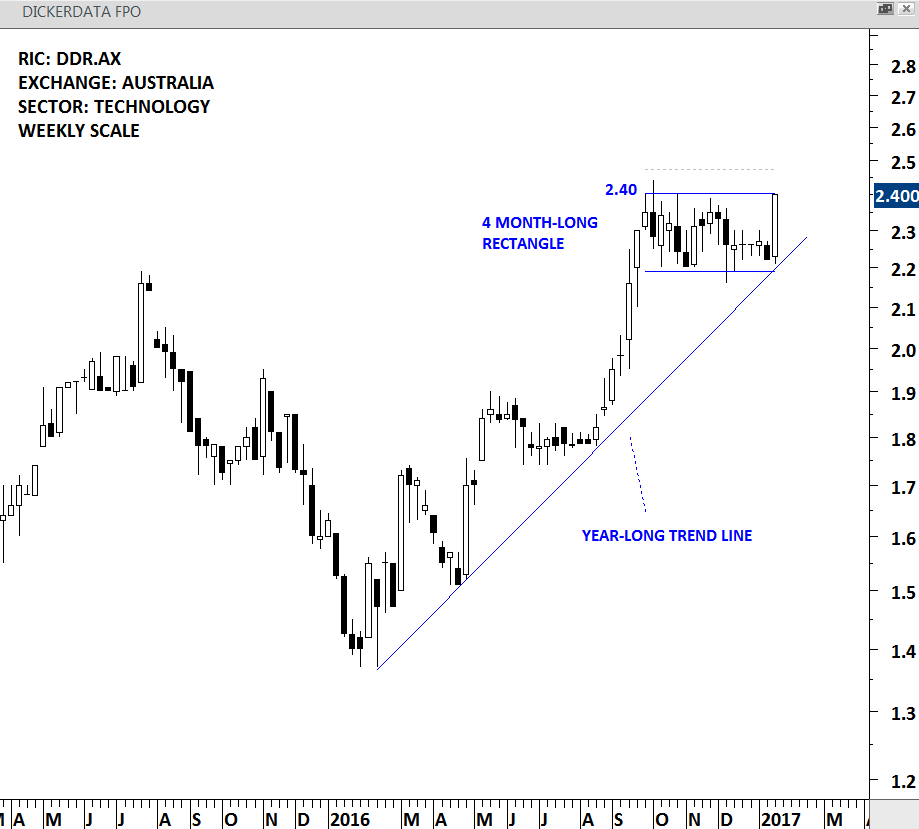
DICKERDATA – WEEKLY SCALE
CINEWORLD GROUP (CINE.L)
CINEWORLD GROUP is a consumer cyclical company listed in the UK. The stock price formed a text-book cup & handle chart pattern. Cup & handle is considered to be a bullish continuation chart pattern. The horizontal boundary stands at 600 level. Breakout from the 16 month-long consolidation can target 720 levels. A daily close above 618 levels will confirm the breakout from the well-defined chart pattern. Breakout will also push the stock to all-time high levels.
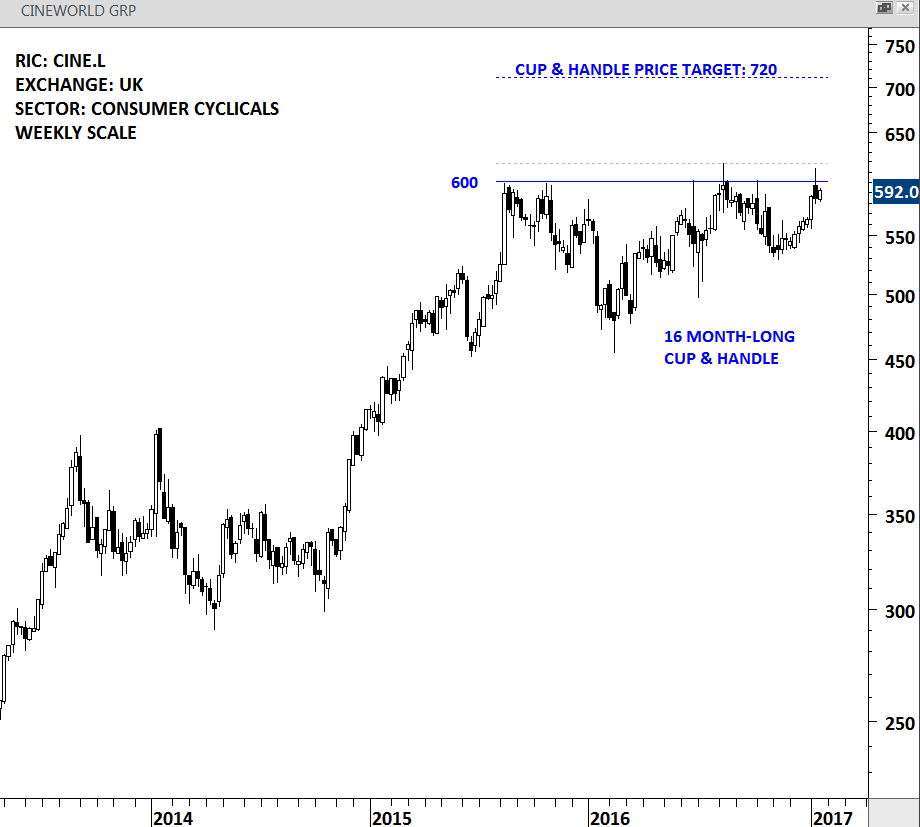
CINEWORLD – WEEKLY SCALE
TAMBURI INVESTMENT PARTNERS (TIP.MI)
TAMBURI is a financial company listed on the Milan Stock Exchange. The company provides services of investment banking and advisory in corporate finance transactions. The stock price formed a 20 month-long H&S continuation chart pattern with the horizontal boundary standing at 3.75 levels. H&S continuation chart pattern price target stands at 4.8 levels. A daily close above 3.85 levels will confirm the breakout from the multi-month consolidation and push the stock to all-time high levels.
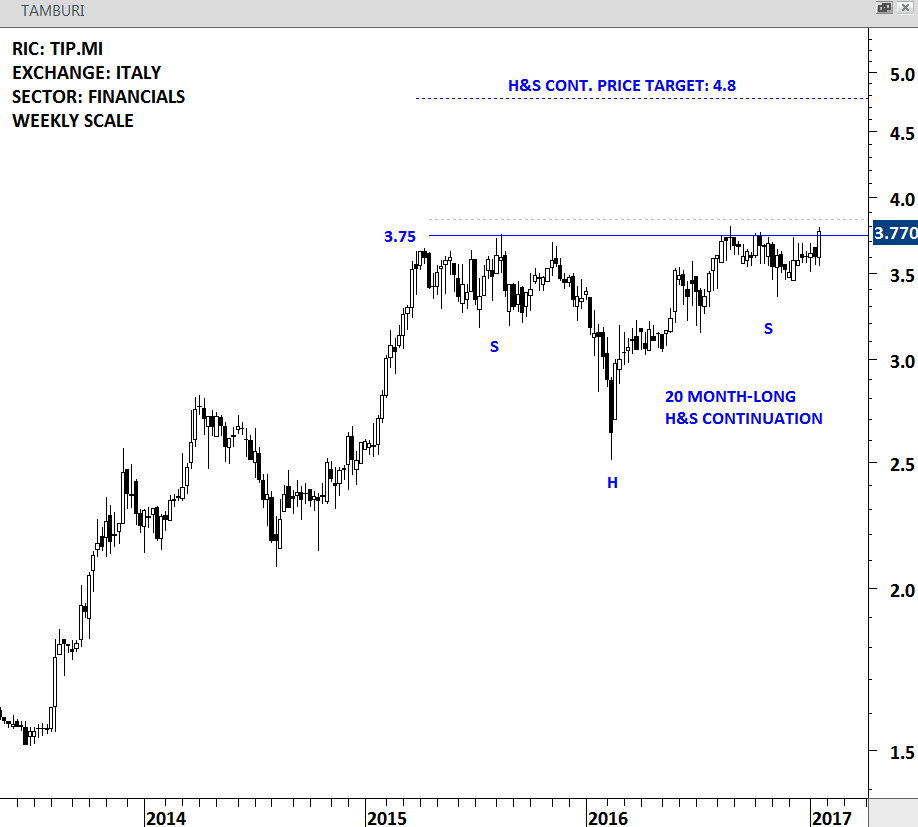
TAMBURI – WEEKLY SCALE
LIBERTY INTERACTIVE CORP. (LVNTA.O)
LIBERTY INTERACTIVE CORP. is a consumer cyclical company listed on the NASDAQ. The company owns interests in subsidiaries and other companies that are engaged in the video and digital commerce industries. The stock price formed a 20 month-long H&S continuation chart pattern with the strong horizontal resistance standing at 41.15 levels. H&S continuation chart pattern price target stands at 50.85 levels. A daily close above 42.40 will confirm the breakout from the multi-month consolidation and push the stock to all time high levels.
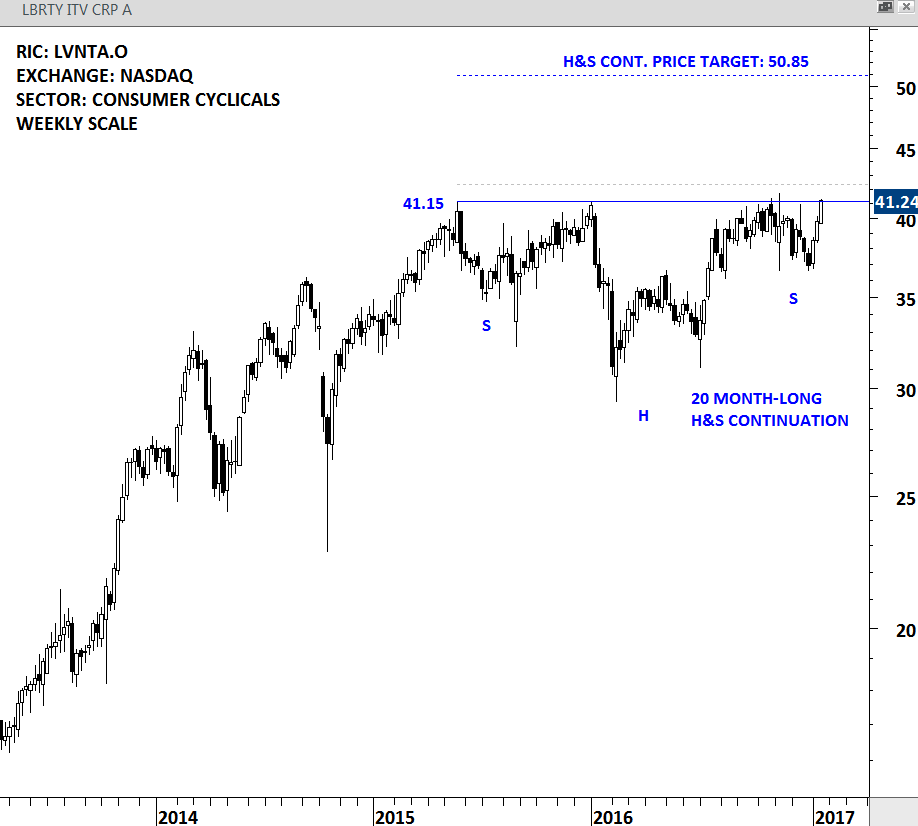
LIBERTY INTERACTIVE – WEEKLY SCALE
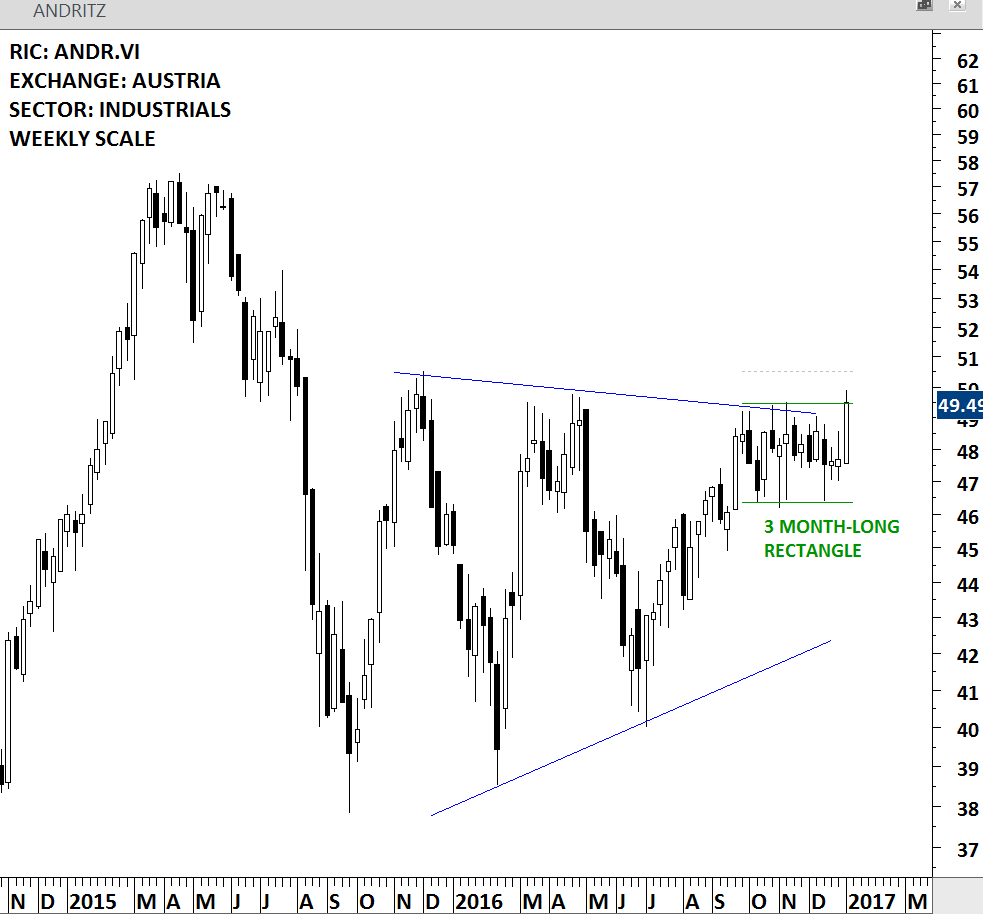
ANDRITZ AG (ANDR.VI)
ANDRITZ is an industrial company listed in the Vienna Stock Exchange. The stock price formed a year-long ascending triangle with the strong horizontal boundary standing at 49.75 levels. The ascending triangle can act as a bottom reversal. A daily close above 50.75 will confirm the breakout from the multi-month consolidation.
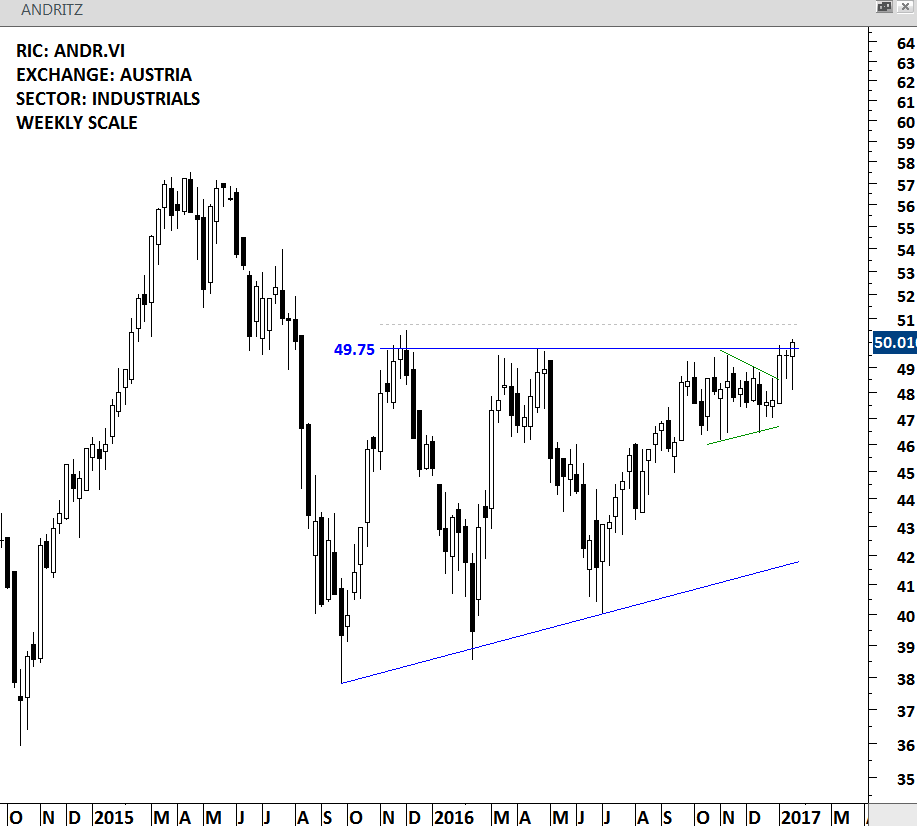
ANDRITZ – WEEKLY SCALE
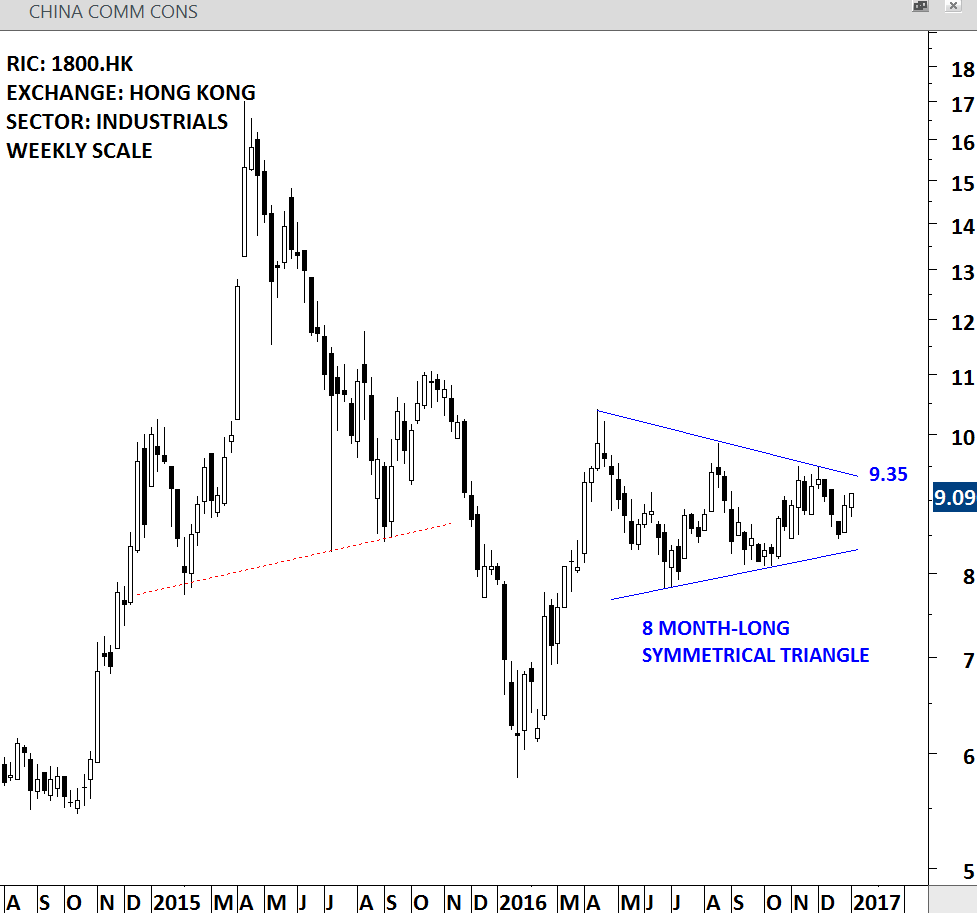
CHINA COMMUNICATIONS CONSTRUCTION (1800.HK)
CHINA COMM CONS. is an industrial company listed on the Hong Kong Stock Exchange. The company is engaged in the infrastructure construction of ports, roads, bridges and railways. The price chart formed a text-book symmetrical triangle. Symmetrical triangles are usually considered to be continuation chart patterns. The upper boundary of the 8 month-long symmetrical triangle was breached this week with a close at 9.40 levels. I will be looking for a daily close above 9.75 levels to confirm the breakout.
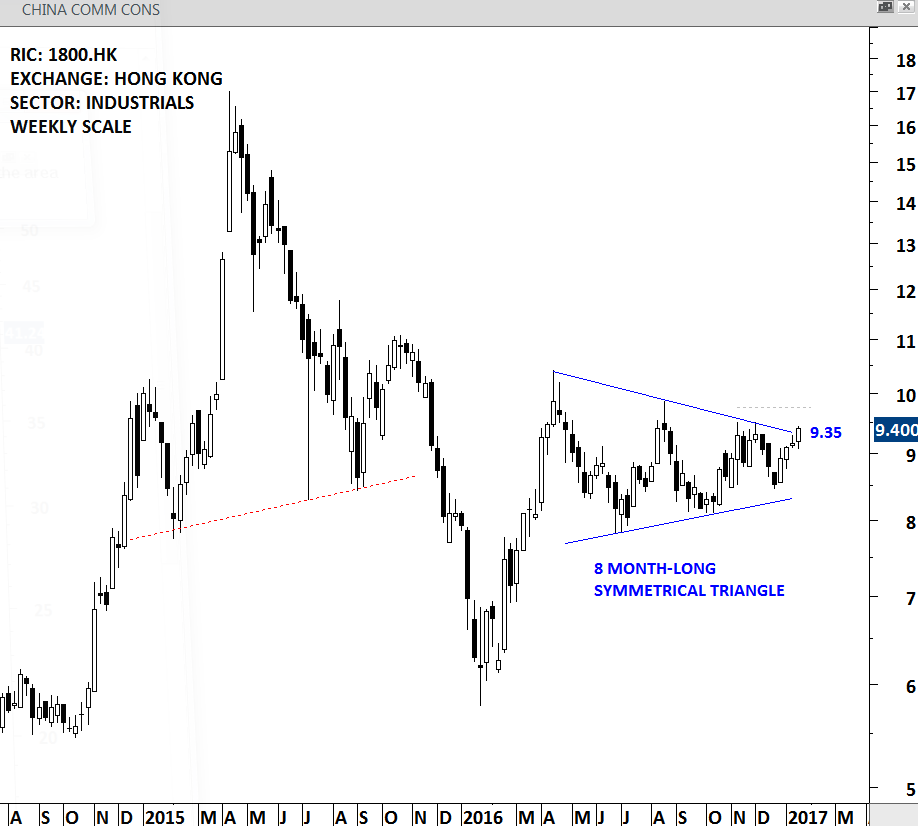
CHINA COMM CONS – WEEKLY SCALE
SINOMA (1893.HK)
CHINA NATIONAL MATERIALS is basic materials company listed on the Hong Kong Stock Exchange. The company is engaged in the provision of cement equipment and engineering services, the production and sales of cement and high-tech materials. While there is still room for the price chart to complete the symmetrical triangle, I thought it is interesting to share these two similar chart patterns in Hong Kong operating in related industries. The 8 month-long symmetrical triangle has resistance at 2.0 levels.
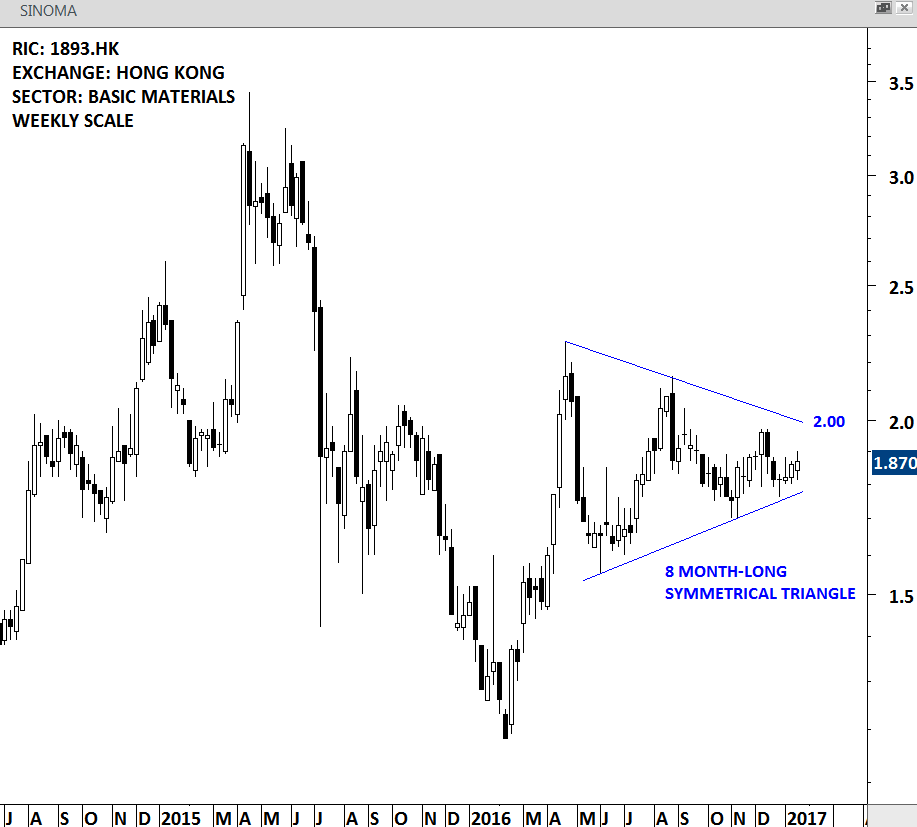
SINOMA – WEEKLY SCALE
ADIRA FINANCE (ADMF.JK)
ADIRA FINANCE is a financial company listed on Jakarta Stock Exchange. Stock price formed a 5 month-long rectangle continuation chart pattern. Strong horizontal resistance was tested for 5 times over the past 5 months. Resistance stands at 6,700 levels. A daily close above 6,900 will confirm the breakout from the sideways consolidation.
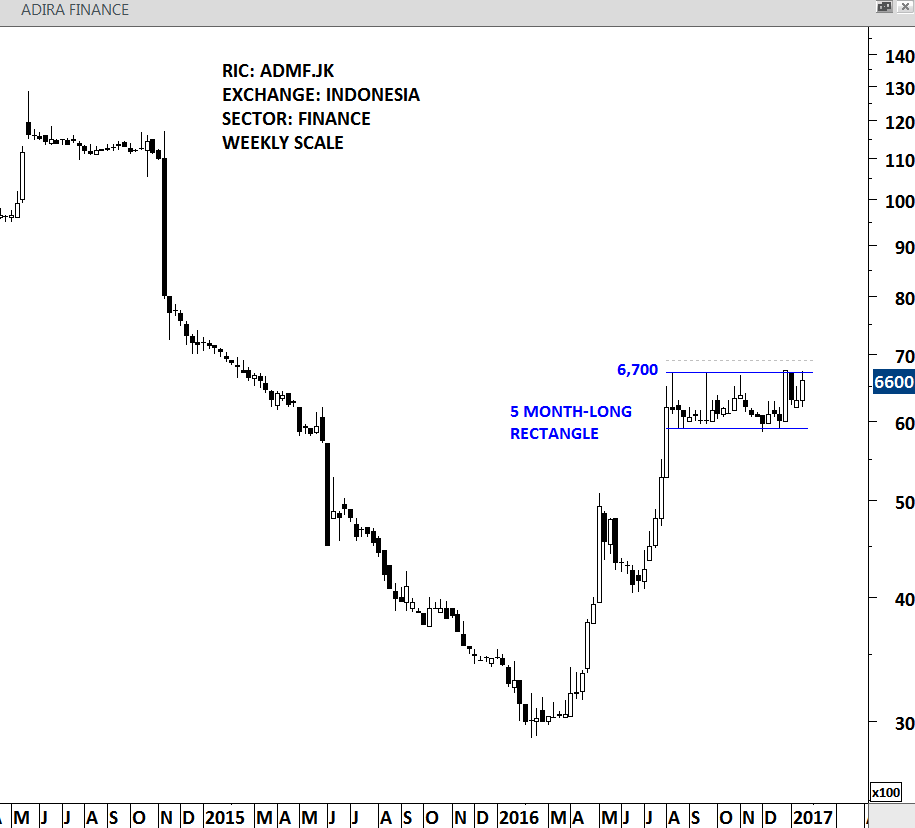
ADIRA FINANCE – WEEKLY SCALE
SALIM IVOMAS PRATAMA (SIMP.JK)
SALIM IVOMAS is a consumer non-cyclical company listed on the Jakarta Stock Exchange. Stock price formed a 9 month-long symmetrical triangle. This week’s price action reversed from the upper boundary of the sideways consolidation at 535 levels. A daily close above 555 levels will confirm the breakout from the bullish continuation chart pattern.
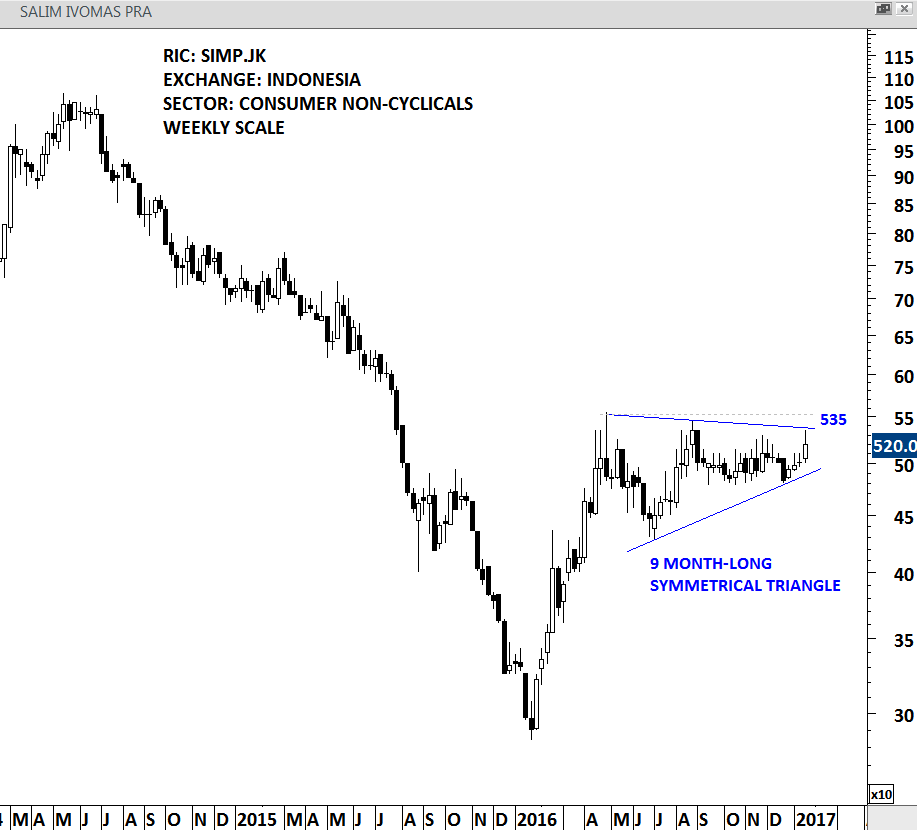
SALIM IVOMAS – WEEKLY SCALE
#TECHCHARTSALERT
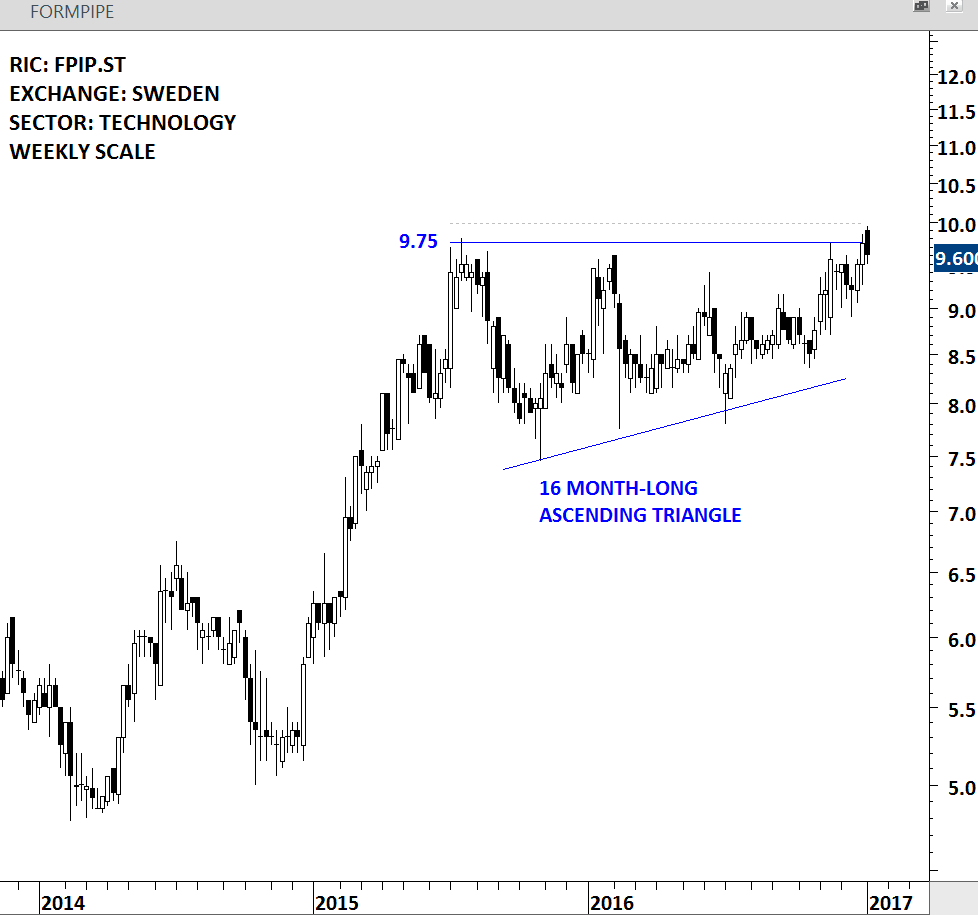
FORMPIPE (FPIP.ST)
FORMPIPE had a strong breakout during the week. Breakout was confirmed with a daily close above 10 levels. Strong price action not only cleared the 16 month-long resistance for the ascending triangle but also the multi-year resistance for the massive symmetrical triangle as can be seen on the monthly scale chart below.
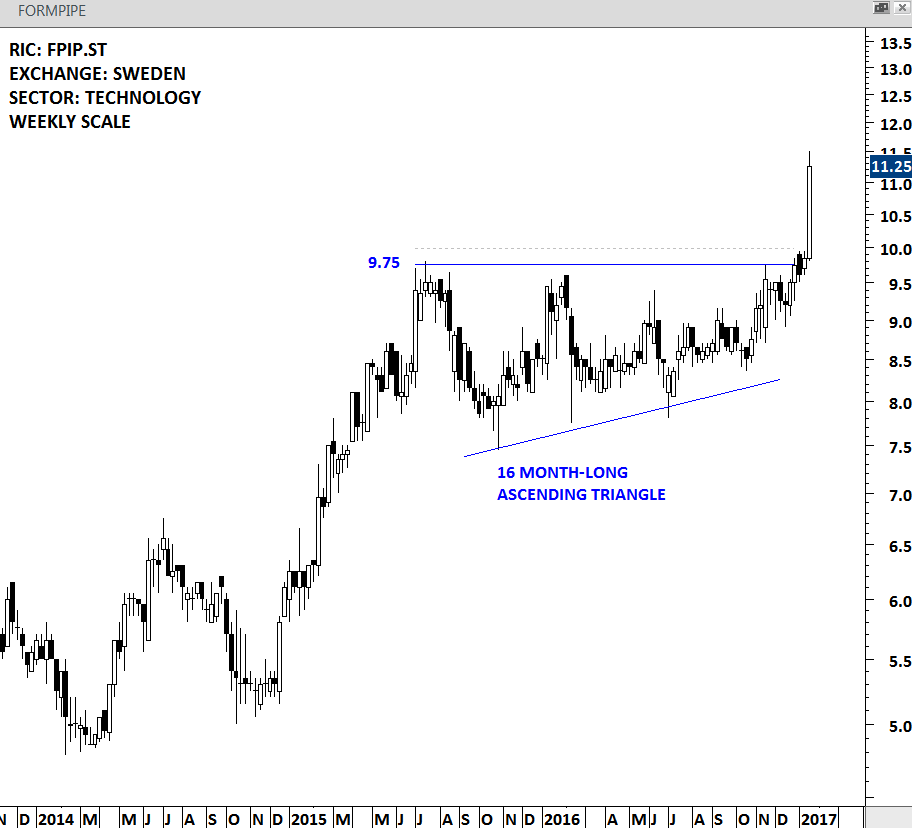
FORMPIPE – WEEKLY SCALE
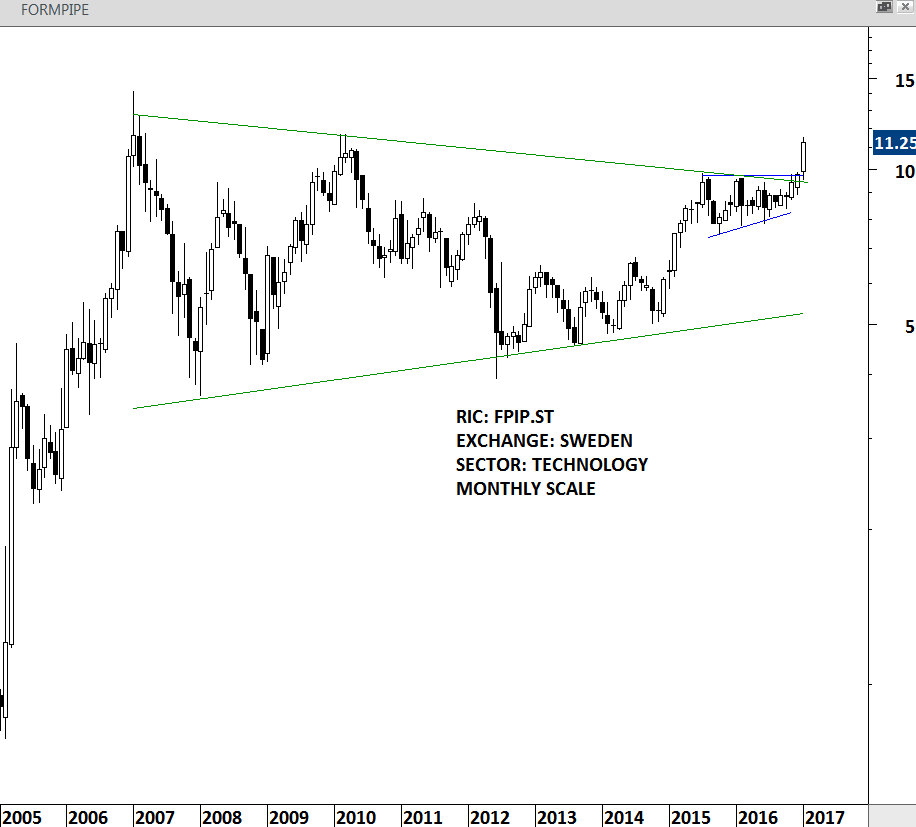
FORMPIPE – MONTHLY SCALE
ASTRAL FOODS (ARLJ.J)
ASTRAL FOODS listed on the Johannesburg Stock Exchange had a strong breakout during the week. Strong weekly close completed the 8 month-long rectangle chart pattern. Price target for the bullish continuation chart pattern stands at 16,000 levels. 13,750 should act as support in the following weeks.
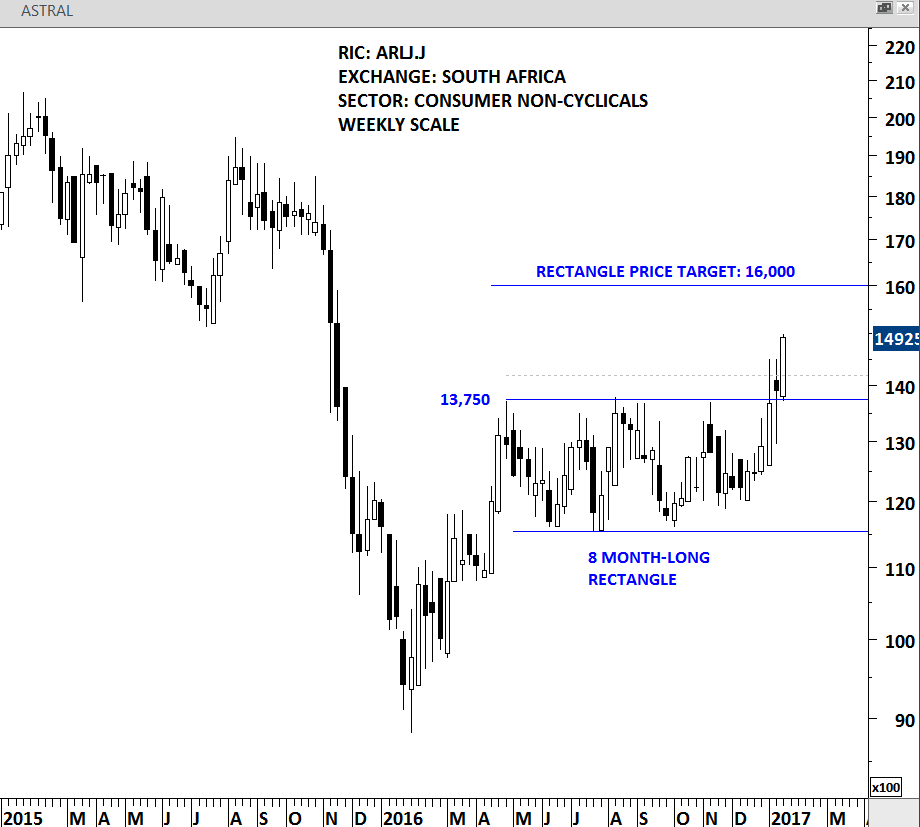
ASTRAL FOODS – WEEKLY SCALE
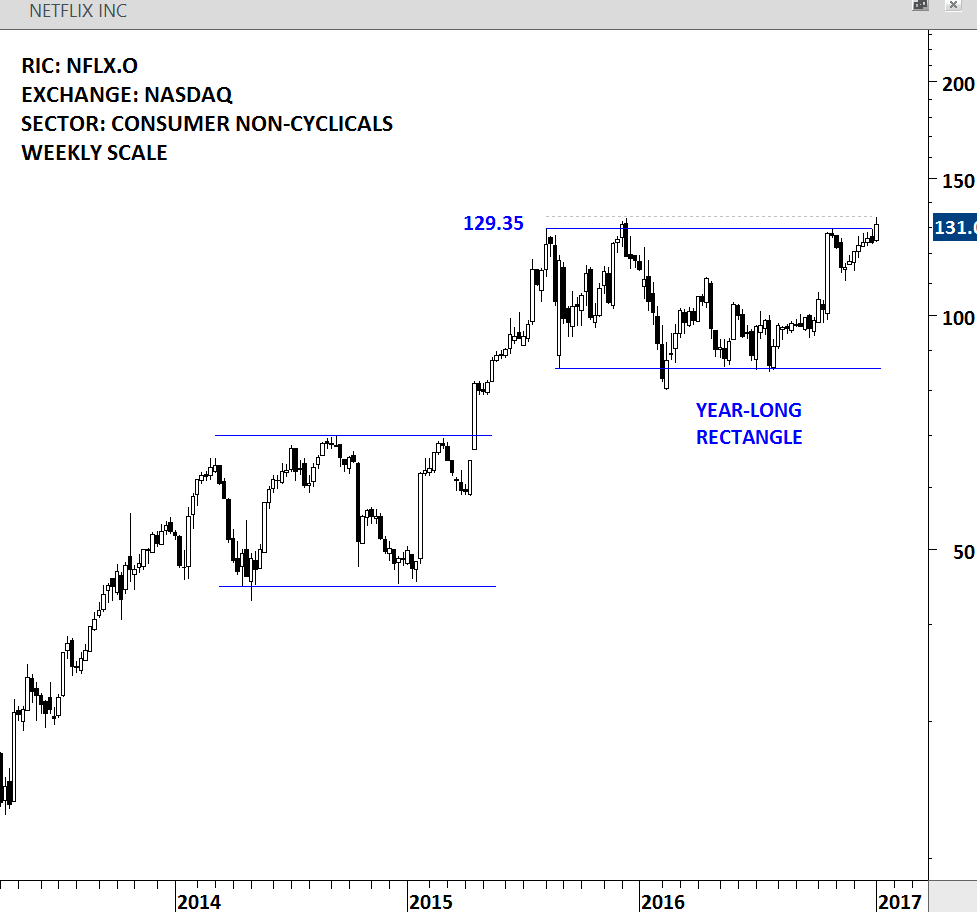
NETFLIX (NFLX.O)
Following its positive earnings this week, NETFLIX completed a year-long rectangle chart pattern. Price should remain above 129.35 levels in the following weeks for the bullish interpretation to remain intact. Rectangle chart pattern price target stands at 175 levels.
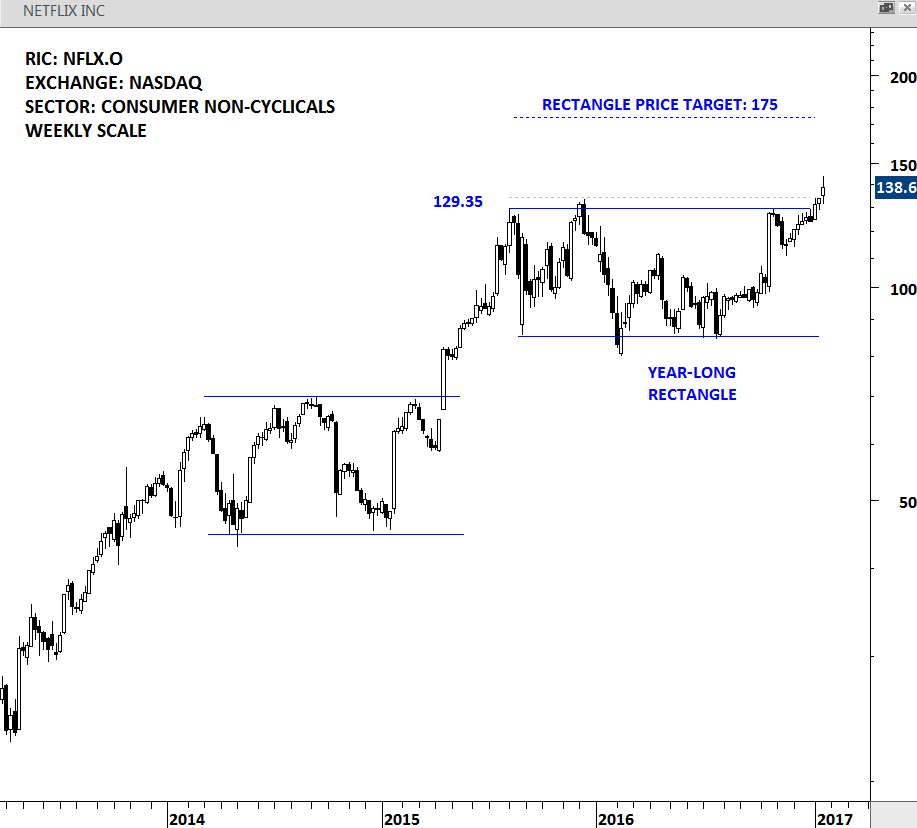
NETFLIX – WEEKLY SCALE