MSCI ALL COUNTRIES WORLD INDEX

Global equity markets are showing weakness. A possible change in trend is in progress. Over the past few decades 2 year moving average proved to be a good indicator for following long-term trends. Price is now below the long-term average and as long as it remains below this technical level probability of further correction in equity markets will increase. 407 level will remain as strong resistance.

MSCI ALL COUNTRIES WORLD INDEX II

CBOE VOLATILITY INDEX (VIX)

CBOE Volatility index moves into a new territory of high volatility. Usually high volatility periods suggest corrections in equity markets. In the past several decades breakouts above 20 levels on the VIX was followed by major equity market corrections.

Chart shows CBOE Volatility Index with weekly closing prices. Last week of August the VIX closed at 26.05 levels which was clearly above strong resistance at 22. Last few weeks surge in volatility cleared two important technical levels. Both the 7 year-long downward sloping trend line and the horizontal resistance at 22 levels were broken on the upside, suggesting a change in trend.

Unless we see a sharp reversal below 22 levels, following weeks/months will lead to higher volatility levels and further weakness in global equity markets.

*Chart shows updated current price as of 1/9/2015 EST 12:30 PM

CBOE VIX

DOW JONES TRANSPORT and UTILITIES

I’m not a big fan of diagonal support/resistances. I like horizontal and clearly defined support/resistance levels on price charts. Especially horizontal support and resistance levels on the weekly and monthly scale charts. However, current price action and the outlook on the U.S. indices is worth mentioning. Most of the major Dow Jones indices are rebounding from trend channel supports.

Trend channel support is more reliable for the Dow Jones Utilities index as the lower boundary of the trend channel was tested several times over the past 5 years.

DOW JONES UTILITIES INDEX


Dow Jones Transportation index is trying to rebound from trend channel support.

DOW JONES TRANSPORTATION INDEX


Dow Jones Composite index which is a combination of Industrials, Transportation and Utilities is also finding support at the lower boundary of its trend channel.

DOW JONES COMPOSITE INDEX

EURO STOXX INDICES

European indices are at critical levels. Breakout higher could result in a multi-year uptrend. Failure to clear those strong long-term resistance levels could signal the end of last 5 year’s uptrend. Whatever the outcome, the implications will be long-term.

STOXX EUROPE 50 index cleared the 15 year-long trend resistance in late 2014. EURO STOXX 50 and EURO STOXX 600 are challenging their long-term trend lines. Fresh breakouts on these two indices could add momentum to the uptrend.

EUROSTOXX 600

EUROSTOXX 50

STOXX 50 INDEX

DOW JONES COMPOSITE INDEX

DOW JONES COMP INDEX

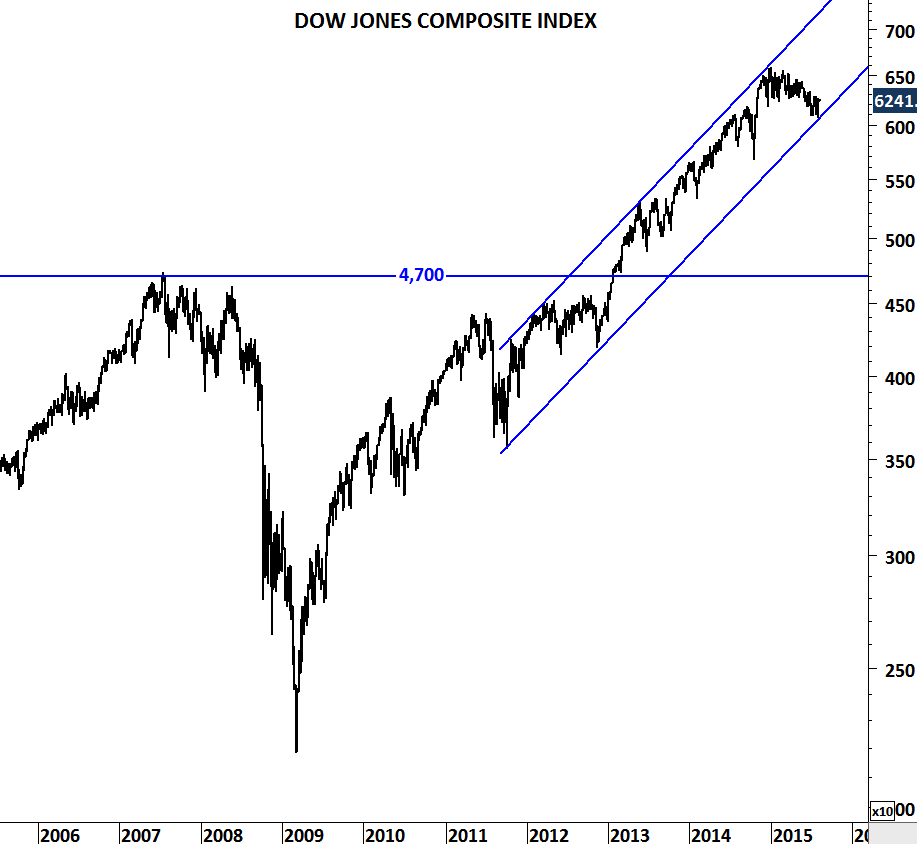
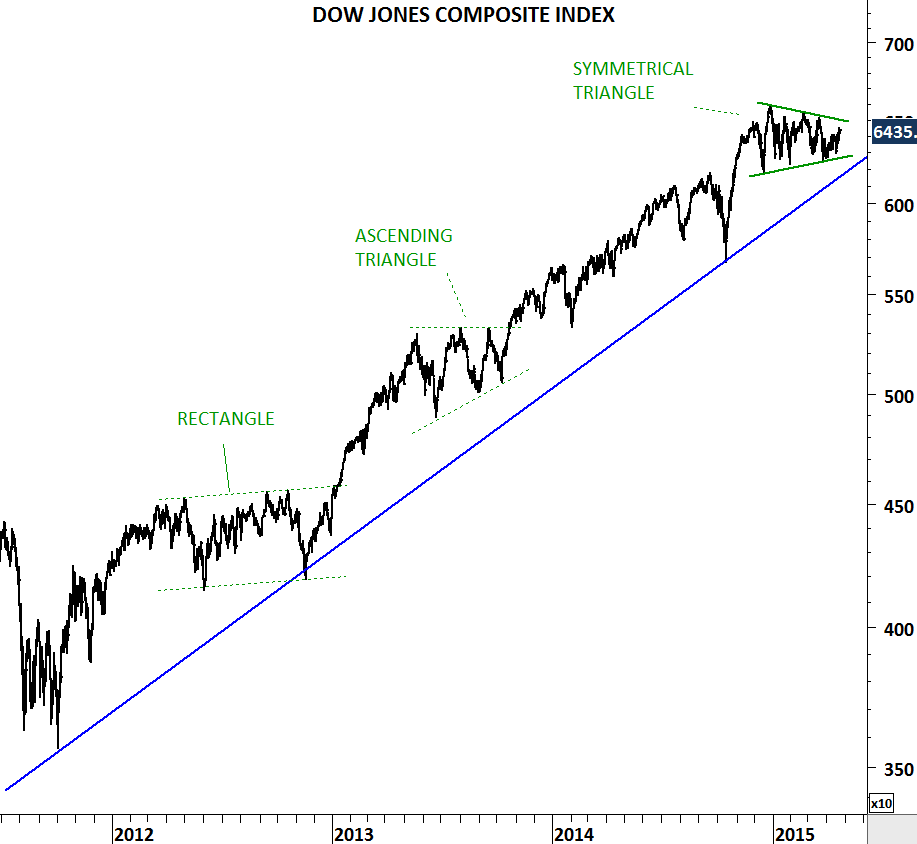
Dow Jones Composite Index measures changes within the 65 companies that make up three Dow Jones averages: the 30 stocks that form the Dow Jones Industrial Average (DJIA), the 20 stocks that make up the Dow Jones Transportation Average (DJTA) and the 15 stocks of the Dow Jones Utility Average (DJUA). The Dow Jones 65 Composite, like the three sub-indexes, is price-weighted.

While there are broader measures of stock market performance for U.S. equities, this is another index that I follow as it offers some clearly identifiable chart patterns. Since the beginning of 2015, Dow Jones Composite Index has been forming a symmetrical triangle, usually regarded as a continuation chart pattern in a strong uptrend. Earlier in 2012 and 2013, Dow Jones Composite index formed other types of continuation chart patterns (rectangle & ascending triangle) and each were followed by breakouts and resumption of the uptrend.

Breakout from the year-long sideways consolidation pattern (symmetrical triangle) can result in another period of strength in U.S. equities. Strong support for the index remains between 6,100 and 6,300. Breakout above 6,500-6,600 area will complete the consolidation.

UK FTSE 100 and STOXX 600

A chart that breaks out to all time high levels has the least resistance. It is called the uncharted territory. Prices are expected to resume their trend after a decisive breakout to all-time high levels. This is what happened with some of the indices over the past few years. I attached below some of the strong breakouts to all-time high levels that have taken place. S&P 500 Index, Germany DAX Index and India BSE SENSEX index are some of them.

S&P 500 INDEX

BSE SENSEX INDEX

GERMANY DAX INDEX

More and more equity indices are now breaking out to all-time high levels or at least preparing for strong breakouts. UK FTSE 100 index is one of them. Index closed the week above strong resistance level at 6,950. Few more weeks of strength will confirm the decade-long breakout.

UK FTSE 100 INDEX

Europe continues to gain strength thanks to ECB. Euro Stoxx 600 index is preparing to clear multi-year resistance at 400 levels. I’m not sure if any of these latest breakouts could end up being bull trap. The best available information (latest price information) suggests strength and increase in upside momentum in global equity indices.

EURO STOXX 600 INDEX

MSCI ALL COUNTRIES WORLD INDEX is now challenging multi-year resistance. Decisive monthly scale close above 430 will confirm the breakout.

MSCI ALL COUNTRIES WORLD INDEX

UK FTSE 100, STOXX 50, NIKKEI 225

Global equity indices are gaining upside momentum. Recent breakouts above long-term trend lines suggest multi-month uptrends. Last week's price action pushed UK FTSE 100 index to all time high levels. Charts that are very close to long-term breakouts: MSCI ALL COUNTRIES WORLD INDEX, EURO STOXX 50 INDEX and UK FTSE 100 INDEX.

Positive price action is likely to continue in the developed market equities.

JAPAN NIKKEI 225 INDEX

Read More

CBOE VIX (VOLATILITY INDEX)

During the sharp correction in October 2014, S&P 500 index reached 1,800 levels and CBOE VIX jumped to 31 levels. VIX is often called the “fear index”. Higher levels of VIX can coincide with market corrections. Over the past 2 months CBOE VIX has been consolidating in a tight range. Consolidation can be a symmetrical triangle. Breakout from this consolidation will result in high volatility for U.S. equities. Breakout above 22.80 levels can send the VIX to 35-40 area. Breakdown below 15.52 levels will be positive for equities. I have posted the S&P 500 index futures on an inverted scale to see the price movements in sync with the VIX. Symmetrical triangle chart pattern (if it is a valid one) should resolve in the next few days/week.

CBOE VIX

S&P 500 INDEX

S&P 500 INDEX (MAR 2015) FUTURES PRICE

AUSTRIA VIENNA ATX INDEX

Austria Vienna ATX Index formed similar chart patterns in different time frames. Since 2009 the index has been consolidating in a wide range. Long-term chart pattern is a symmetrical triangle. Over the past six months, ATX index formed a short/medium-term consolidation; another symmetrical triangle. Direction of the breakout from the short-term consolidation range will be important. Breakout above 2,280 levels will push the index towards 2,500. Breakdown below 2,000-2,100 range can be very negative in the long-term.

AUSTRIA VIENNA ATX INDEX

CBOE VIX (VOLATILITY INDEX)

Volatility can move higher in the following months if we see a decisive weekly close above 22 levels. In the last two years CBOE VIX consolidated in a range between 11 and 22. Six year-long downward trend line and the upper boundary of the horizontal consolidation range meet at 22 levels. A decisive break above 22 levels can result in a sharp upward move towards 40-45 area. Such price action will be bearish for global equity markets. It is important to keep a close eye on this chart development in the next few months.

CBOE VIX

Chart is plotted on a weekly scale and closing prices are taken into consideration.