S&P 500 INDEX and VIX

S&P 500 INDEX weekly scale price chart

S&P 500 INDEX weekly scale price chart

S&P 500 index is resting on the 2 year-long support/resistance level. Breakout to all time highs in July 2016 was followed by a weak rally in July-August period. Since mid-August the index has been in a sideways consolidation. The pull-back reached the previously broken resistance at 2,120 levels. Price action in the September-October period can be identified as a descending triangle with the horizontal boundary (support) standing at 2,120 levels. Over the past two months the S&P 500 index tested the strong support for 3 times. Breakdown below 2,120 levels will signal further correction for the U.S. Equities.

CBOE Volatility index is consolidating between 13 and 17 levels. Breakdown below 2,120 on the S&P 500 index could also result in a breakout on the VIX. The level to watch on the CBOE VIX is 17.35. If S&P 500 index manages to hold above 2,120 levels, last two months sideways consolidation will be labelled as a pull back and we will expect new highs in the coming months. In that case 17-18 area should become a medium term high for the CBOE VIX.

S&P 500 INDEX daily scale price chart

S&P 500 INDEX daily scale price chart

CBOE VOLATILITY INDEX daily scale price chart

CBOE VOLATILITY INDEX daily scale price chart

ENERGY and EQUITIES

WTI CRUDE OIL and BRENT CRUDE OIL prices are developing bullish chart patterns. Year-long inverse H&S chart patterns are close to completion. Both WTI Crude and Brent Crude are challenging their necklines. For Brent Crude oil the year-long horizontal resistance stands at $52 levels. For WTI, the neckline stands at $50 levels. Breakout above the strong resistances can push prices towards $70 levels in the following months. $70 is the possible H&S bottom price target.

WTI CRUDE OIL weekly scale price chart

WTI CRUDE OIL weekly scale price chart

BRENT CRUDE OIL weekly scale price chart

BRENT CRUDE OIL weekly scale price chart

Similar bullish technical outlook can be identified on several equities in the energy sector and energy related exchange traded funds. Below are some of the equities from Tech Charts watchlist. Note: According to Edwards & Magee a breakout is confirmed when a stock records a daily close above the resistance by 3% margin. Levels on the charts below take this guideline into consideration.

OMV AG an Austria based integrated oil and gas company forms a year-long symmetrical triangle. Stock has been challenging the upper boundary of its consolidation. Breakout above 26.5 levels should generate fresh chart pattern breakout signal.

omv-ag

CHINA OIL & GAS Group limited is a Hong Kong based investment holding company principally engaged in natural gas and energy-related businesses. A decisive close above 0.65 will confirm breakout from year-long H&S chart pattern.

china-oil-gas

PREMIER OIL is an independent exploration and production company with oil and gas interests in the North Sea, South East Asia, Pakistan, the Falkland Islands and Latin America. The company is engaged in the business of upstream oil and gas exploration and production. Since the beginning of May 2016 the stock has been forming a rectangle (continuation) chart pattern with the boundaries between 59.75 and 80.35. A decisive close above 82.40 will confirm breakout from the 6 month-long rectangle chart pattern.

premier-oil

CANYON SERVICES GROUP provides stimulation and fluid management services to oil and gas exploration and production companies operating in the Western Canadian Sedimentary Basin. The company’s segments include Pressure Pumping Services and Fluid Management Services. Price chart of the, Toronto Stock Exchange listed Canyon Services has a text-book H&S bottom chart pattern. Year-long base formation has a horizontal resistance (neckline) at 5.87 levels. A decisive close above 6.05 will confirm breakout from the year-long H&S bottom.

canyon-services

HALLIBURTON COMPANY is a provider of services and products to the upstream oil and natural gas industry. Price chart of the U.S. energy stock formed an inverted triangle with the horizontal boundary standing at 46.85 levels. Over the past 4 months, the resistance was tested 3 times. Breakout above 48.30 levels will complete the multi month consolidation.

halliburton

LAREDO PETROLEUM is an independent energy company focused on the acquisition, exploration and development of oil and natural gas properties, and the transportation of oil and natural gas from such properties primarily in the Permian Basin in West Texas. Price chart of Laredo Petroleum is forming a year-long H&S bottom with the neckline standing at 13.70 levels. A decisive close above 14.15 levels will confirm breakout from the bullish base formation.

laredo-petr

HELIX ENERGY is an international offshore energy services company. The company provides services to the offshore energy industry with a focus on well intervention and robotics operations. Price chart of HELIX ENERGY formed a 5 month-long symmetrical triangle. Breakout is underway with the strong weekly close of last week’s price action.

helix-energy

GEOSPACE TECHNOLOGIES CORP designs and manufactures instruments and equipment used in the oil and gas industry to acquire seismic data in order to locate, characterize and monitor hydrocarbon producing reservoirs. GEOSPACE TECHNOLOGIES formed a year-long H&S bottom with the neckline standing at 19 levels. A decisive close above 20 levels will confirm breakout from the multi-month bullish chart pattern.

geospace-techn

ISHARE GLOBAL ENERGY ETF is an exchange traded fund listed in the NYSE. The price chart of the energy ETF has a similar year-long H&S bottom with the neckline standing at 33.15 levels. A decisive close above 34.10 will confirm breakout from the multi-month base formation. The right shoulder of the H&S bottom can be identified as a rectangle with the boundaries standing at 30.50 and 33.15.

ishares-glob-energy

S&P 500 INDEX and MSCI ACWI

Over the past two weeks, global equity markets rebounded from strong support levels. Last two week’s recovery came after the S&P 500’s pull back to its long-term support level at 2,125 levels. Long-term charts of S&P 500 index and a broader representation of global equity market performance, the MSCI ALL COUNTRIES WORLD INDEX, possibly completed a re-test of the broken resistance/support levels. Once a resistance is cleared it becomes support and vice versa.

S&P 500 index, a benchmark for large cap US equities broke out of a year-long sideways consolidation in mid-July. After reaching 2,193 levels in mid-August, the index pulled back to test the broken resistance at 2,125 levels. Both the year-long upward trend line and the horizontal support held well and the index rebounded without any technical damage to the long-term trend. Unless the markets reverse once again to challenge the support at 2,125 levels, we will claim the latest price action was a pullback and is likely to be followed by a resumption of the long-term uptrend.

Monthly scale price chart of S&P 500 index

Monthly scale price chart of S&P 500 index

Weekly scale price chart of S&P 500 index

Weekly scale price chart of S&P 500 index

MSCI ALL COUNTRIES WORLD INDEX captures large and mid cap representation across 23 Developed Markets and 23 Emerging Markets countries. With 2,481 constituents, the index covers approximately 85% of the global investable equity opportunity set. Please note that iShares has an MSCI ACWI ETF that seeks to track the MSCI ALL COUNTRIES WORLD INDEX.

In mid-July MSCI ACWI, similar to S&P 500 index, completed a significant chart pattern. A year-long H&S continuation chart pattern was completed with a breakout above 410 levels. Since then the index possibly completed a pull back to the neckline of the H&S chart pattern. Last week’s sharp reversal increased the likelihood of a continuation towards 443 levels. Unless the index reverses to challenge the support at 405 levels, we will identify the latest price action as a pullback that is likely to be followed by a resumption of the long-term uptrend.

Monthly scale price chart of MSCI ACWI

Monthly scale price chart of MSCI ACWI

Weekly scale price chart of MSCI ACWI

Weekly scale price chart of MSCI ACWI

If global equity indices mentioned above resume their uptrends, we are likely to see fresh new highs on several individual securities. Financial media usually pays attention to 52 week highs as a measure of security’s strength. There is even a better way to look at this; all-time highs. It is usually difficult for investors to buy stocks that are reaching their all-time highs. But usually the most promising part of an uptrend starts when a stock moves into uncharted territory in other words all-time highs. Below are some of the stocks on my watch-list that are likely to breakout to all-time highs and some that are likely to record 52 week highs. These stocks formed clear bullish chart patterns with identifiable horizontal boundaries. Breakouts will not only complete the chart patterns but also will push the stocks to all time highs and 52 week highs.

U.S. & CANADA

aaon-inc

booz-allen-hmltn

brookfield-am

costar-group

euronet-wordlwide

geospace-techn

gug-frontier-mkts

icf-intl

suntrust-bks

EUROPE

aak

moncler

JAPAN & HONG KONG

coolpad-group

meiji-holdings

sankyu

sunac

CHINA SSE 5O INDEX

Chinese equities might be on the verge of a strong breakout. This week’s price action pushed the SSE 50 Index to the horizontal resistance at 2,225 levels. Since the beginning of 2016, SSE 50 has been recording higher lows, a bullish signal. Another week of strong price action can clear the 8 month-long resistance and push the index towards 2,500 levels. Volatility is low both on the daily and weekly charts suggesting a trend period might develop after a decisive breakout.

CHINA SSE 50 INDEX W

CHINA SSE 50 INDEX D

There are several bullish chart set-ups in Hong Kong listed securities. I share below some of the clear chart patterns that are likely to resolve on the upside if we see a breakout on the Chinese benchmark equity index.

MGM CHINA

MGM CHINA formed a year-long H&S bottom, a bullish reversal chart pattern, with the neckline standing at 12.20 levels. Breakout above 12.20 can push the stock higher to test 17-18 area.

TONGDA GROUP

TONGDA GROUP formed a year-long ascending triangle, a bullish continuation chart pattern, with the strong horizontal resistance standing at 1.69. Breakout above 1.69 can push prices towards 2.0 levels.

PING AN

PING AN is now testing the horizontal resistance at 38.80. Stock closed slightly above the resistance. However, this week’s price action will confirm the breakout. Another strong weekly close will complete the multi-month base formation.

Note: According to Edwards and Magee, a daily close above the resistance by a 3% margin is required to confirm a breakout. I follow this approach to confirm a breakout.

BASIC MATERIALS and ENERGY

In the first few months of 2016, strong performance in Gold and Silver resulted in a sharp rally in precious metal stocks. Several oversold gold and silver mining companies had strong performance over the past few months. Similar bullish theme can take place in the basic materials and energy complex. Some of the commodities in the industrial metals and energy group are in the process of forming major long-term bottoms. The same bullish chart set ups can also be seen in the equities of basic materials and energy companies.

LIGHT CRUDE OIL SEP FUTURES

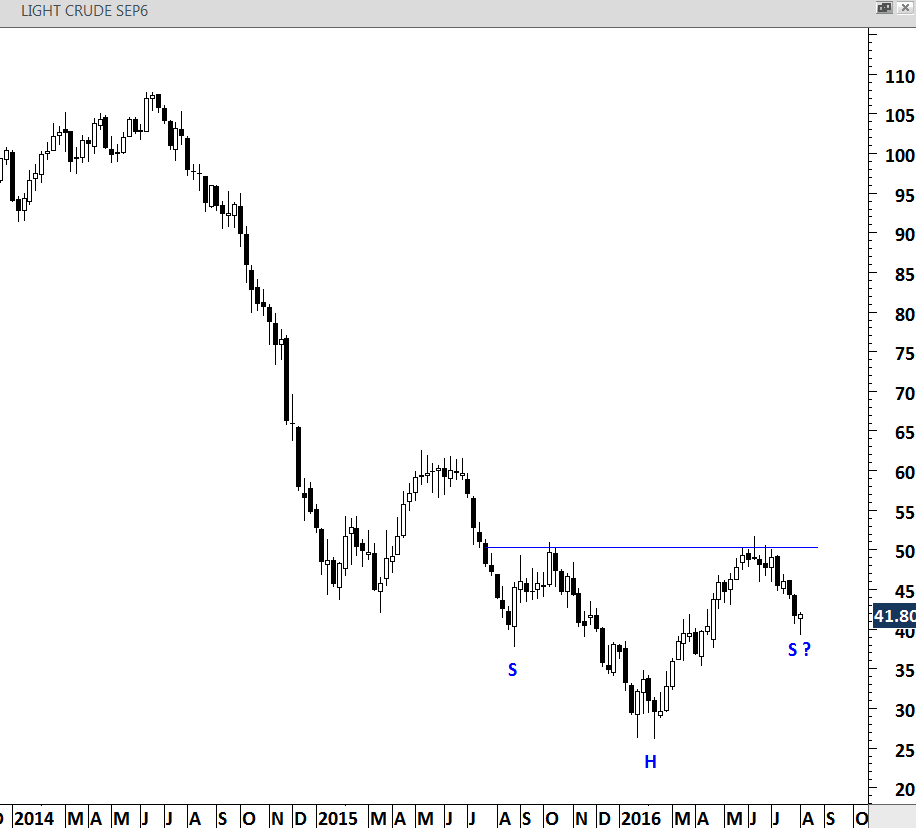
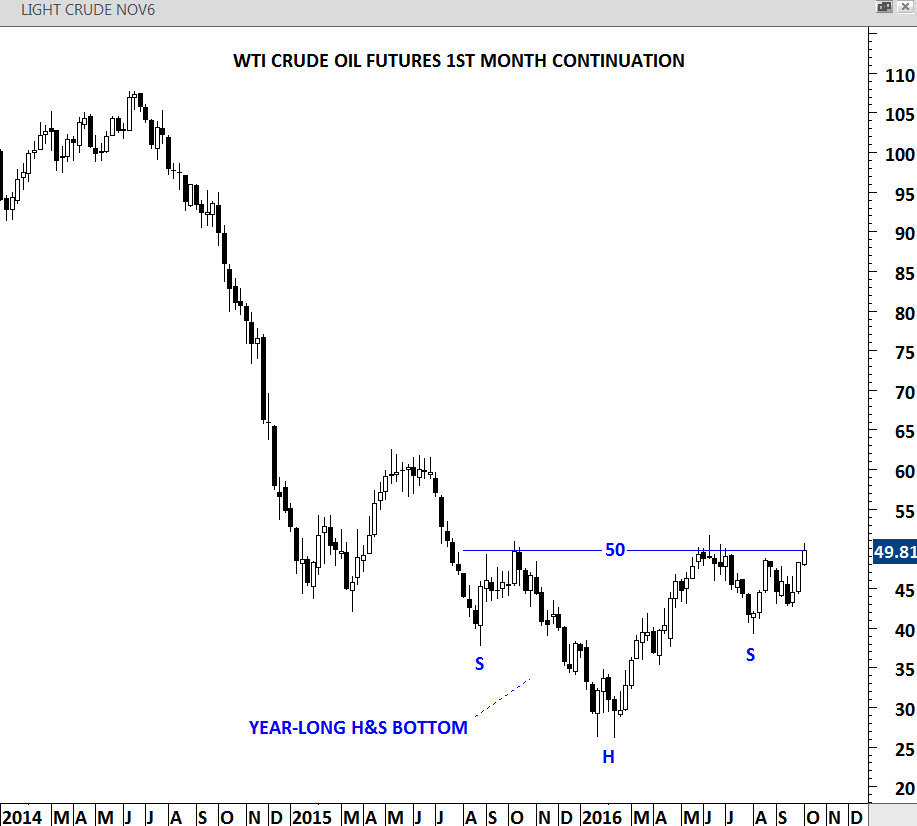
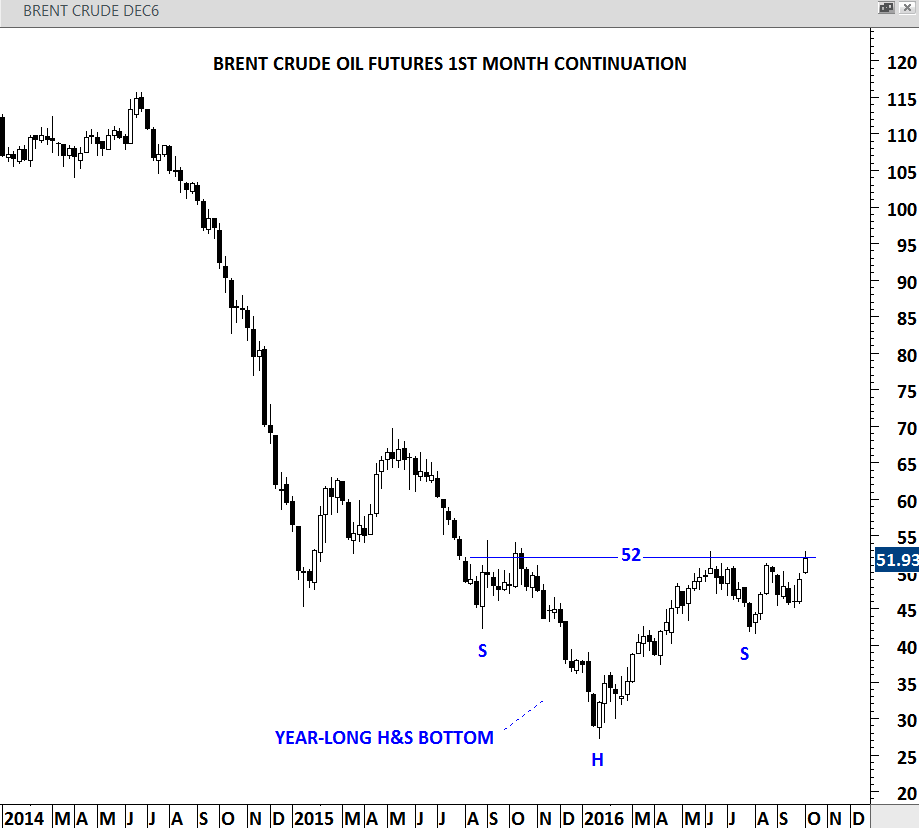
WTI LIGHT CRUDE is possibly forming a H&S bottom with the neckline standing at $50 levels. This chart is still at the early stages of a H&S formation. A few more weeks of strength will complete the right shoulder of a year-long base formation.

BLOOMBERG INDUSTRIAL METAL SUB INDEX

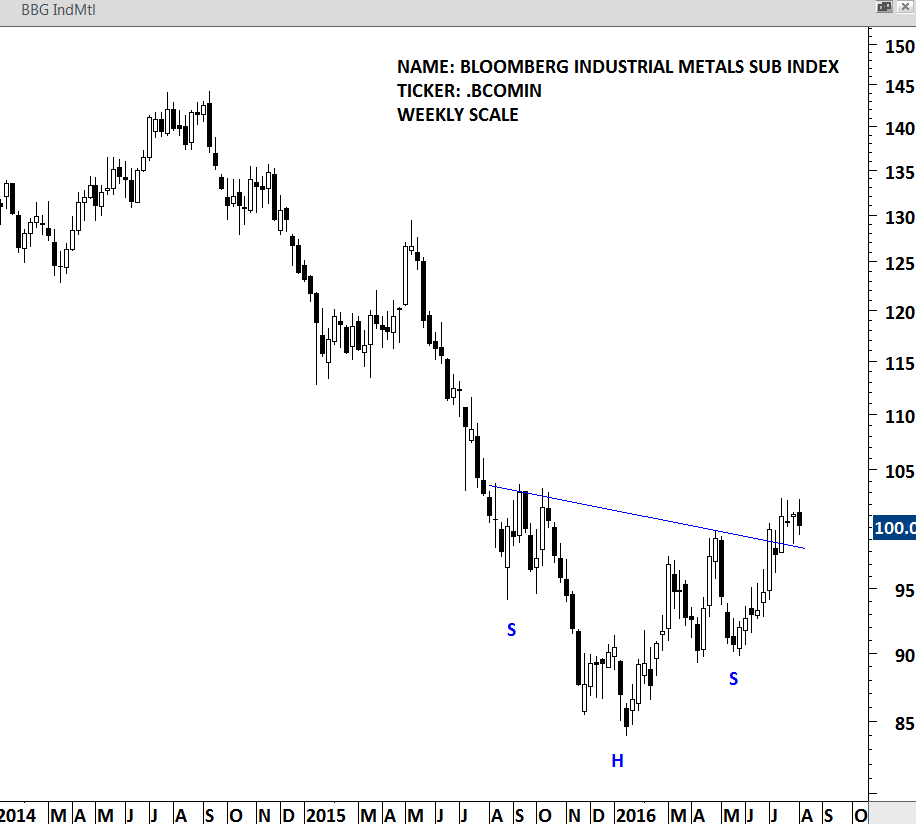
Formerly known as Dow Jones-UBS Industrial Metals Subindex Total Return (DJUBINTR), the index is a commodity group subindex of the Bloomberg CITR. The index is composed of longer-dated futures contract s on aluminum, copper, nickel and zinc. It reflects the return on fully collateralized futures positions and is quoted in USD. This chart has possibly completed a H&S bottom and currently consolidating above the neckline.

BLOOMBERG ALUMINUM SUB INDEX

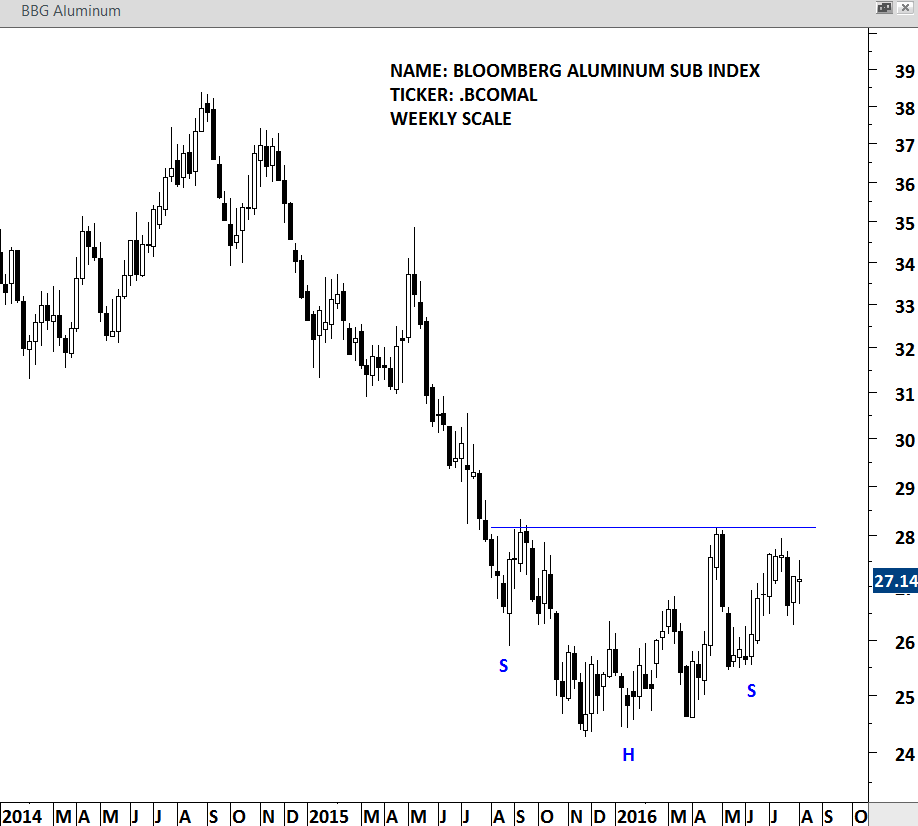
Formerly known as Dow Jones-UBS Aluminum Subindex Total Return (DJUBALTR), the index is a single commodity subindex of the Bloomberg CI composed of futures contracts on Aluminum. It reflects the return of underlying commodity futures price movements only and is quoted in USD. The neckline of the year-long base formation stands at 28.20 levels.

NMDC LIMITED

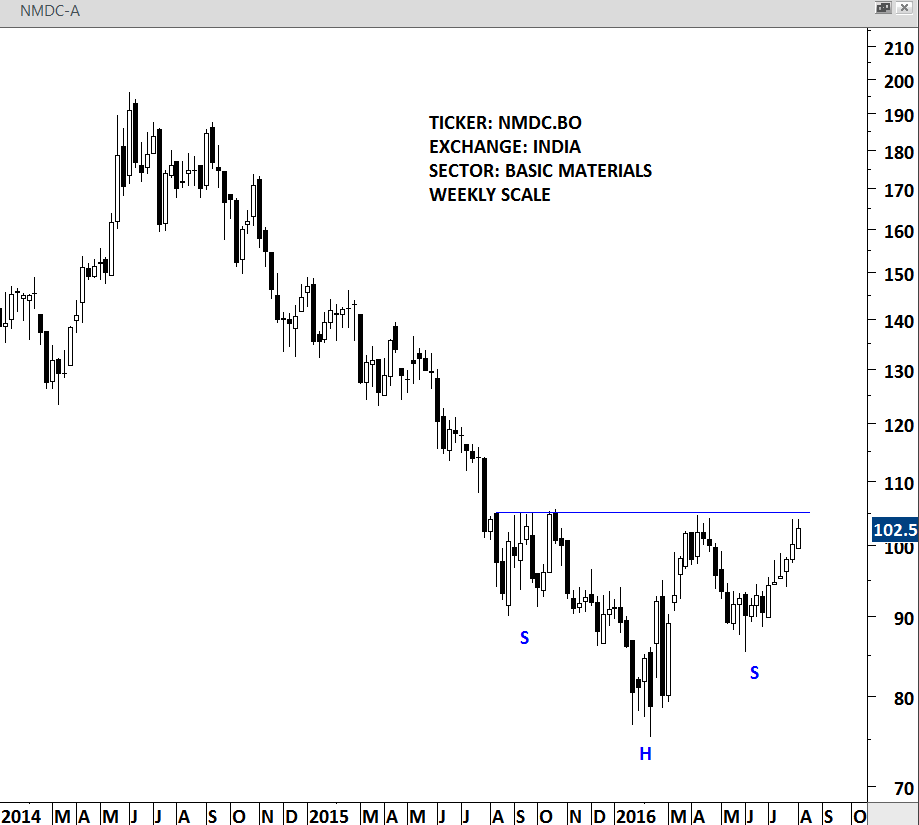
NMDC Limited is an India-based company engaged in the mining of iron ore. The Company’s business segments include Iron Ore and Other minerals & services. The Company is also engaged in the exploration of various minerals, including copper, rock phosphate, lime stone, dolomite, gypsum, bentonite, magnesite, diamond, tin, tungsten, graphite and beach sands. A perfect horizontal resistance (neckline) stands at 105 levels. Breakout above this level will complete a year-long base formation.

FREEPORTMCMORAN

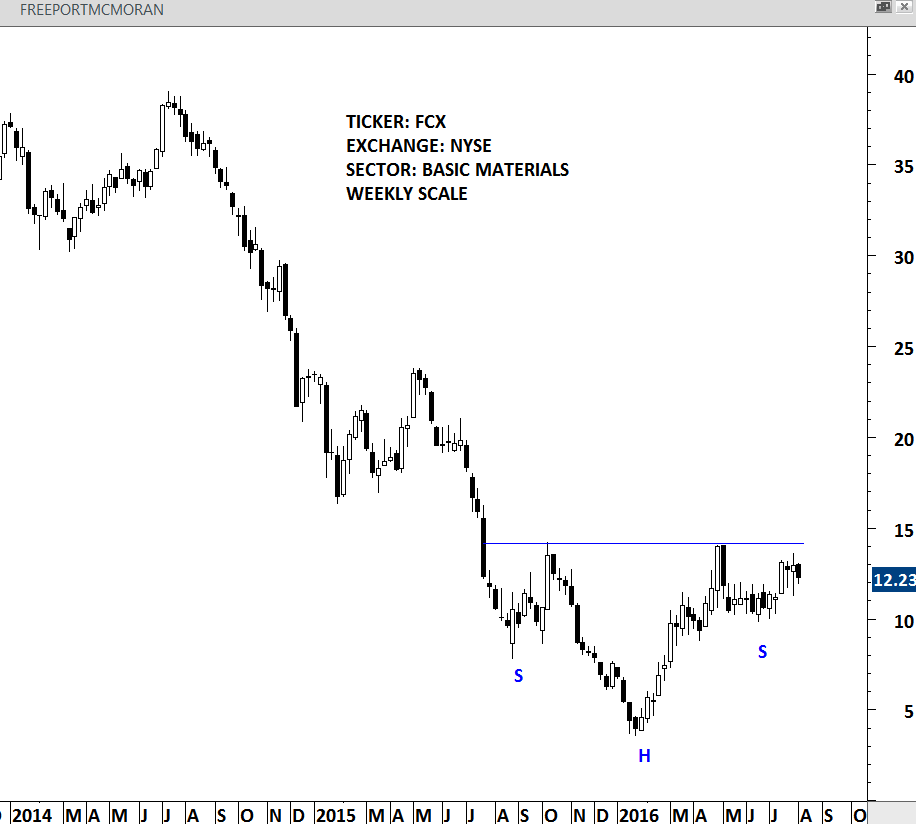
Freeport-McMoRan Inc. (FCX) is a natural resource company with a portfolio of mineral assets, and oil and natural gas resources. The Company’s segments include the Morenci, Cerro Verde, Grasberg and Tenke Fungurume copper mines, the Rod & Refining operations and the U.S. Oil & Gas Operations. It has organized its operations into five primary divisions: North America copper mines, South America mining, Indonesia mining, Africa mining and Molybdenum mines. This is another perfect example of a year-long H&S bottom with the neckline standing at 14.20 levels. Breakout above 14.20 will be bullish and possibly target 25 levels.

TECHNIP

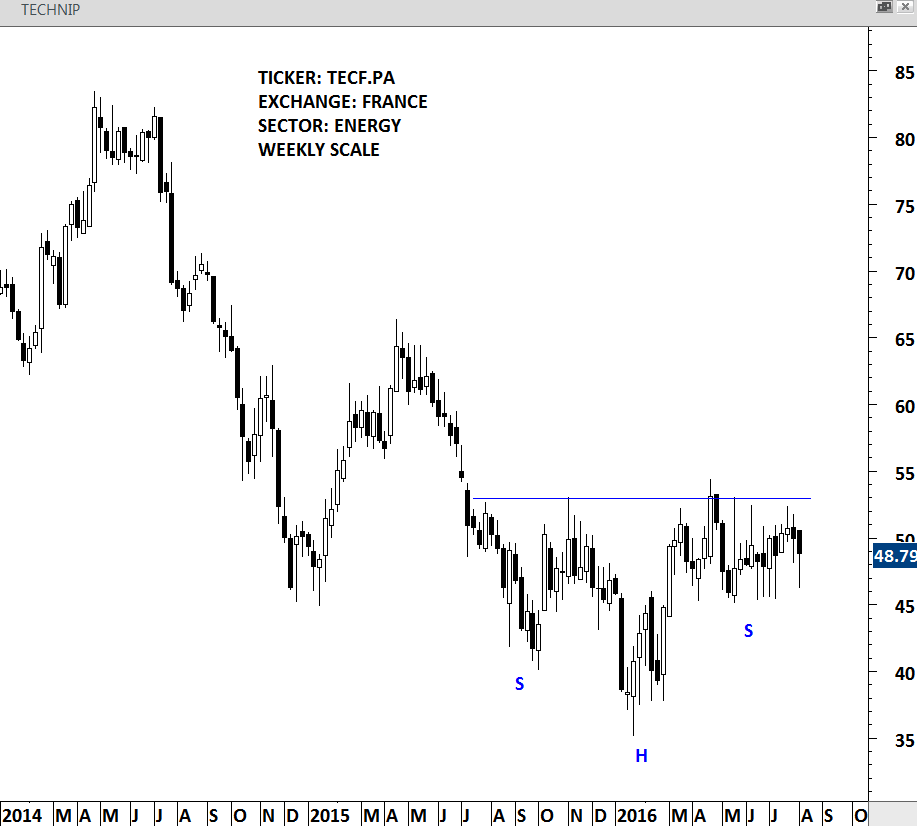
Technip SA (Technip) is engaged in project management, engineering and construction for the energy sector. The Company operates through two segments: Subsea, Onshore/Offshore and Corporate. This stock is listed in France. Over the past year, 53 levels acted as strong resistance. Stock might be completing a year-long base.

WACKER CHEMIE

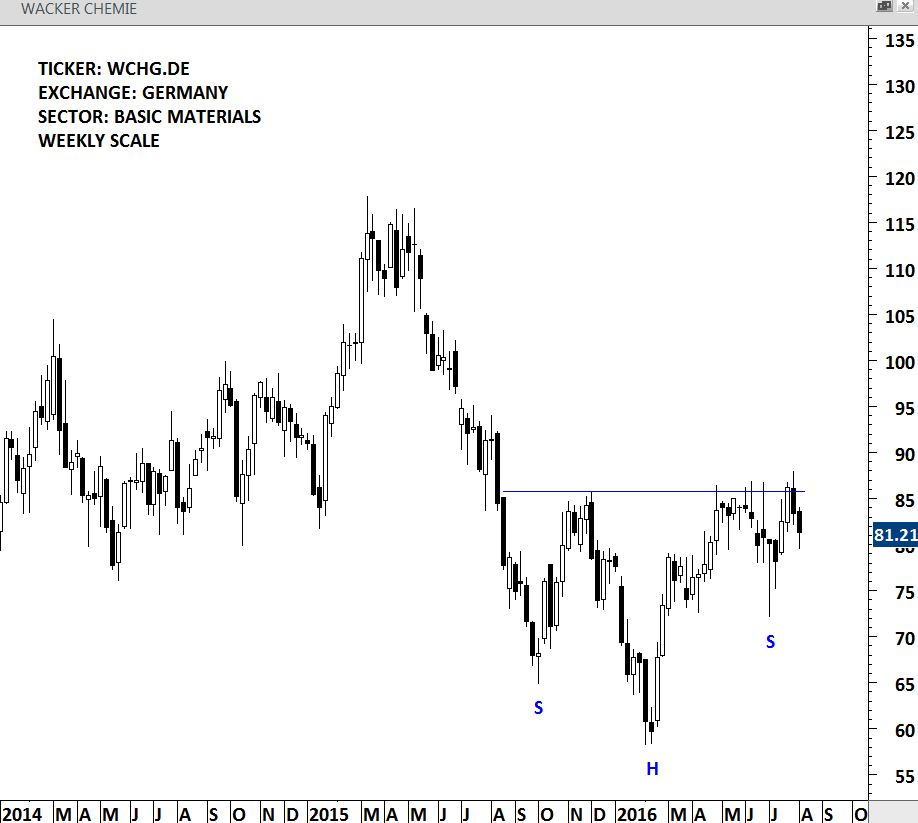
Wacker Chemie AG is a Germany-based company engaged in chemical industry. The Company operates through four business segments: WACKER SILICONES, which produces silicone products, ranging from silanes through silicone fluids, emulsions, elastomers, sealants and resins to pyrogenic silicas; WACKER POLYMERS, which offers a range of polymeric binders and additives; WACKER POLYSILICON, which provides polysilicon, and WACKER BIOSOLUTIONS, which is the life science division of the Company, offers solutions and products for the food, pharmaceutical and agrochemical industries. While this base formation does not have the perfect symmetry between the left and right shoulders, it is clear from the chart that the horizontal resistance at 86 levels will be critical in the coming weeks. Breakout above 86 will be bullish.


TURKEY BIST 100

Turkish equities are at critical support levels from where they can see a possible turnaround. We are talking about a country and financial markets that experienced a failed coup, an S&P downgrade and a recently declared state of emergency. Yet the magnitude of the correction is less than what BIST 100 experienced after the Gezi Park protests in 2013 and much smaller in magnitude when compared with the banking crises in 2000-2003 and the global financial melt-down in 2007-2008. Is it possible to say the worst is over?

TURKEY BIST 100 W

Long-term chart of the BIST 100 index shows the multi-year long uptrend being tested between 70K-72K area. This is also the lower boundary of a larger scale sideways correction which I label it as a symmetrical triangle.

TURKEY BIST 100 D

Daily chart shows the 3 year-long sideways consolidation. After the recent sell-off the BIST 100 index is now very close to strong support area between 70K and 72K. Unless we see a breakdown below the strong support area, we will expect a rebound and a possible reversal.

MSCI TURKEY VS MSCI EM

MSCI Turkey has underperformed MSCI Emerging Markets index. Though, the ratio between MSCI TURKEY and MSCI EM is now at a major support level. This ratio is indexed to 1 with the base year being 2016. Since the beginning of the year, including the latest sell-off the ratio stands at 0.92. This is 8% underperformance versus the MSCI EM. More important than the numbers, I think the level of the ratio suggests a possible reversal. Unless there is a breakdown below 0.90-0.94 area, being long Turkey versus MSCI EM at this inflection point could be a low risk trade.

BIST 100 INDEX

IND VS BIST

Corrections led by a financial/economic cause has been deeper and more lengthy when compared with corrections led by political turmoil. Recent data from 1996 till today supports this conclusion. 2000-2003 was the banking crisis in Turkey. 2007-2008 was the global financial melt-down. Both has been the major corrective periods on BIST 100 index. 2011-2012 was related to the global recession fears and the global equity corrections. Since 2013, BIST 100 is in a sideways consolidation.

During each corrective period, Industrials outperformed the BIST 100 index. In other words Financials have under-performed. Risk on trade for Turkish equities have always been buying the financials. Industrials have been a defensive play. The ratio between Industrial Index and BIST 100 reached 2003 levels. If there is a turnaround (a market reversal), you should keep an eye on the performance of financials in the coming weeks. This ratio should also reverse from 2003 levels.

Several charts above suggests equity markets in Turkey are at a major turning point. If we see stability at these levels I’ll weigh going long Turkey.

MEXICO IPC INDEX

A strong breakout is likely to take place on Mexico’s IPC Index. Last week’s price action breached multi-year horizontal resistance at 46,500 levels. The horizontal resistance was tested for 5 times over the past four years. Another week of strong price action will confirm the breakout on the local price index and will suggest higher levels in the coming months. It is important to note that both on weekly and monthly scale the index is going through low volatility period. Usually breakouts from such technical condition result in prolonged up/down trends depending on the direction of the breakout.

MEXICO IPC INDEX W

MEXICO IPC INDEX D

U.S. DOLLAR/TURKISH LIRA

U.S. Dollar continues to appreciate against the Turkish Lira. Over the past three years strong uptrend pushed the cross rate from 1.8 levels to 3 levels. Long-term charts suggest the uptrend can resume in the coming weeks after a year-long sideways consolidation.

USD/TRY is possibly forming a symmetrical triangle, usually regarded as a continuation chart pattern. Price is now trading between 2.8 and 3.0 levels. Breakout above 3.0 levels will complete the chart pattern and possibly target 3.2-3.3 area. Strong support remains at 2.8 levels. If there is a decisive breakdown below 2.8 levels, symmetrical triangle will serve as a major trend reversal. In that case there will be enough evidence to favor stronger Turkish Lira.

USDTRY WEEKLY

In both cases a decisive breakout is required to confirm the completion of the year-long sideways price action.

On the daily chart price formed a possible H&S continuation, increasing the likelihood of an upward break. It is clear from both daily and weekly charts that 3.0-3.05 area is very critical for USD/TRY in the following weeks.

USDTRY DAILY

MEXICO IPC INDEX

Mexico IPC index is possibly preparing for a strong breakout to all-time high levels. Over the past three years, the IPC index tested the strong horizontal resistance for the 5th time. Since the beginning of April, price held close to the upper boundary. Last two months sideways consolidation can be a symmetrical triangle and a preparation for a breakout above 46,500 levels. 46,000-46,500 will act as strong resistance in the following weeks. A decisive weekly close above the resistance area can launch a multi-month uptrend for Mexico’s IPC index. Breakdown below 44,500 can result in a lengthy consolidation.

MEXICO IPC INDEX WEEKLY SCALE PRICE CHART

MEXICO IPC INDEX WEEKLY SCALE PRICE CHART

MEXICO IPC INDEX DAILY SCALE PRICE CHART

MEXICO IPC INDEX DAILY SCALE PRICE CHART


U.S. DOLLAR/CHINESE YUAN

Once again emerging market currencies started weakening against the U.S. Dollar. Earlier update analyzed the Turkish Lira, South African Rand and Mexican Peso.  In this blog post I review the existing uptrend on USD/CNY.

U.S. Dollar/Chinese Yuan is reversing from a critical support level. Since the second half of 2015, USD/CNY has been recording higher highs and higher lows. First, a breakout above 6.26 followed by another strong breakout above 6.448, clearly established the strong dollar weak yuan trend. Last 4 months price action was possibly a pullback to the previously broken resistance at 6.448 and it might be over. Reversal from strong support area can be followed by another upward spike towards 6.65-6.70 area.

Weekly scale price chart of USD/CNY

Weekly scale price chart of USD/CNY

The daily scale chart shows the breakout from the last 4 months downward trend channel. As long as the USD/CNY remains above 6.45-6.50 area, strong USD weak CNY trend will remain intact in the second half of the year.

Daily scale price chart of USD/CNY

Daily scale price chart of USD/CNY