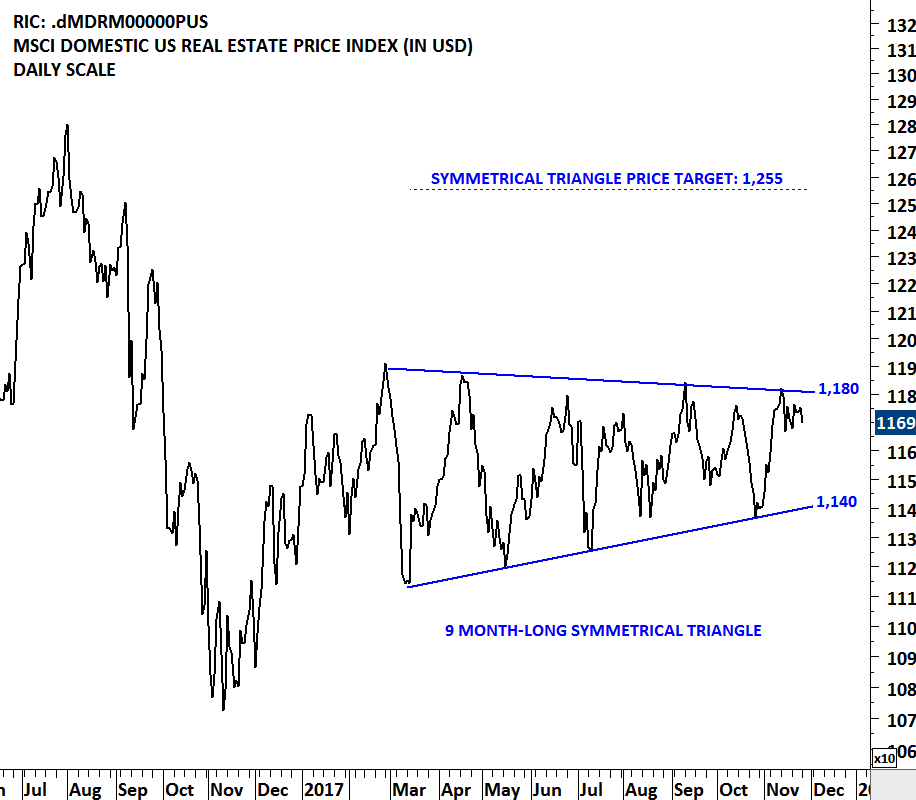
MSCI DOMESTIC U.S. REAL ESTATE PRICE INDEX

The MSCI Domestic U.S. Real Estate Index and related REIT ETFs are going through a lengthy consolidation. Breakouts from tight and lengthy consolidations are usually followed by strong directional movement. Price index respected the boundaries of the 9 month-long symmetrical triangle. Both boundaries were tested several times over the past months. The upper boundary of the possible symmetrical triangle is acting as resistance at 1,180 levels and the lower boundary as support at 1,140 levels. A decisive breakout above 1,180 levels will confirm the symmetrical triangle as a bullish continuation with a possible chart pattern price target of 1,255 levels.

Read more

GLOBAL EQUITY MARKETS – November 25, 2017

REVIEW


The MSCI Domestic U.S. Real Estate Index and related REIT ETFs are going through a lengthy consolidation. Breakouts from tight and lengthy consolidations are usually followed by strong directional movement. Price index respected the boundaries of the 9 month-long symmetrical triangle. Both boundaries were tested several times over the past months. The upper boundary of the possible symmetrical triangle is acting as resistance at 1,180 levels and the lower boundary as support at 1,140 levels. A decisive breakout above 1,180 levels will confirm the symmetrical triangle as a bullish continuation with a possible chart pattern price target of 1,255 levels. Below you can find related ETFs to take advantage of a possible directional movement on the MSCI Domestic US Real Estate Price Index.

Read more

MSCI EMERGING MARKETS INDEX

Emerging Markets equities continue to remain strong. A widely followed benchmark for the Emerging Markets equity performance, MSCI Emerging Markets index resumes its multi-month uptrend in a steady parallel trend channel. Last one month’s short-term consolidation can be identified as a possible flag; a bullish continuation chart pattern. The lower boundary of the flag at 1,100 level will act as a short-term support. Earlier in July 2017, the MSCI Emerging Markets index cleared a decade-long trend line resistance at 1,015 levels as shown on the monthly scale price chart.

Read more

GLOBAL EQUITY MARKETS – November 18, 2017

REVIEW


Emerging Markets equities continue to remain strong. A widely followed benchmark for the Emerging Markets equity performance, MSCI Emerging Markets index resumes its multi-month uptrend in a steady parallel trend channel. Last one month’s short-term consolidation can be identified as a possible flag; a bullish continuation chart pattern. The lower boundary of the flag at 1,100 level will act as a short-term support. Earlier in July 2017, the MSCI Emerging Markets index cleared a decade-long trend line resistance at 1,015 levels as shown on the monthly scale price chart.

Read more

CONSUMER DISC. SELECT SECTOR SPDR FUND (XLY)

Consumer Discretionary Select Sector SPDR (XLY) Fund (the Fund) seeks to provide investment results that correspond to the price and yield performance of the Consumer Discretionary Select Sector of the S&P 500 Index (the Index). The Index includes companies from industries, such as automobiles and components, consumer durables, apparel, hotels, restaurants, leisure, media and retailing. The ETF is listed on the New York Stock Exchange. Price chart formed a 5 month-long rectangle with the boundaries acting as resistance at 92.35 and support at 88.15 levels. Both the upper and lower boundary of the rectangle was tested several times. A daily close above 93.25 levels will confirm the breakout from the sideways consolidation with the possible chart pattern price target of 96.6 levels. You can check out the sample video below on bullish rectangle continuation.

Here are some of the sample educational videos you might find valuable.  This sample video explains how to identify rectangles and to calculate possible chart pattern price targets. Tech Charts Educational Videos cover major reversal and continuation chart patterns.

Read more

GLOBAL EQUITY MARKETS – November 11, 2017

REVIEW


During established up trends pullback to the long-term averages are considered to be low risk entry points. A widely followed trend indicator is the 200 day moving average. Price action above the 200 day moving average is recognized as an uptrend, while price trading below the 200 day (40 week) average is considered to be a downtrend. In the last quarter of 2016, the Euro Stoxx Banking index breached its long-term average on the upside what was considered to be the beginning of a possible uptrend. Since then, each pullback found support at the long-term moving average, confirming the steady uptrend. Over the past 5 months, the Euro Stoxx Banking index formed a sideways consolidation that can be identified as a symmetrical triangle. Read more

BREAKAWAY GAPS

Every week Tech Charts Global Equity Markets report features some of the well-defined, mature classical chart patterns under a lengthy watchlist and the chart pattern breakout signals that took place during that week. Global Equity Markets report covers single stocks from developed and emerging markets, ETF’s and global equity indices. The report starts with a review section that highlights the important chart developments on global equity benchmarks. This blog post features one of several great chart analysis from the latest Global Equity Markets report as a case study discussing the breakaway gaps.

In his book Technical Analysis and Stock Market Profits, Richard W. Schabacker discusses different kinds of price gaps. Below are some of the important points he mentions about Breakaway Gaps.

Read more

GLOBAL EQUITY MARKETS – November 4, 2017

REVIEW


If there is one theme and well-defined similar chart pattern set ups that I need to highlight, it is in the Gold and Silver mining equities. I discussed the developing chart patterns in an earlier Global Equity Markets report and the Interim update. Whenever similar chart patterns are identified on different equities in the same industry and sector, the price action becomes more important. The Tech Charts Watchlist features some of the well-defined chart setups in the gold & mining equities. In a timely manner, we have also added a new video tutorial for members on Descending Triangle as a bearish reversal chart pattern.

Read more

INTERIM UPDATE – November 3, 2017

French auto industry is showing signs of strength and offering major breakout opportunities. September 30, 2017 Global Equity Markets report featured the breakout from a multi-month base formation on the long-term price chart of PEUGEOT AS. This interim update highlights another major opportunity that is taking place in the same industry.

Read more