
BREAKAWAY GAPS
Every week Tech Charts Global Equity Markets report features some of the well-defined, mature classical chart patterns under a lengthy watchlist and the chart pattern breakout signals that took place during that week. Global Equity Markets report covers single stocks from developed and emerging markets, ETF’s and global equity indices. The report starts with a review section that highlights the important chart developments on global equity benchmarks. This blog post features one of several great chart analysis from the latest Global Equity Markets report as a case study discussing the breakaway gaps.
In his book Technical Analysis and Stock Market Profits, Richard W. Schabacker discusses different kinds of price gaps. Below are some of the important points he mentions about Breakaway Gaps.
It is always difficult and frequently impossible to be certain whether a Gap is of the Common or Break-away variety at the instant that the Gap appears. This is the principal reason why we cannot place too much credence in the various Gap theories and why we must consider Gaps as of only secondary importance in forecasting. The fact remains that most Gaps which lead decisively out of an established pattern are not closed; they become and remain true Break-away Gaps. And the wider the Gap at a break-out, the less likely it is to be closed.
The Break-away Gap emphasizes the break-out of prices and indicates a sudden change in the technical picture, but the mere fact that prices have broken decisively out of a technical formation is of greater importance than the Gap.
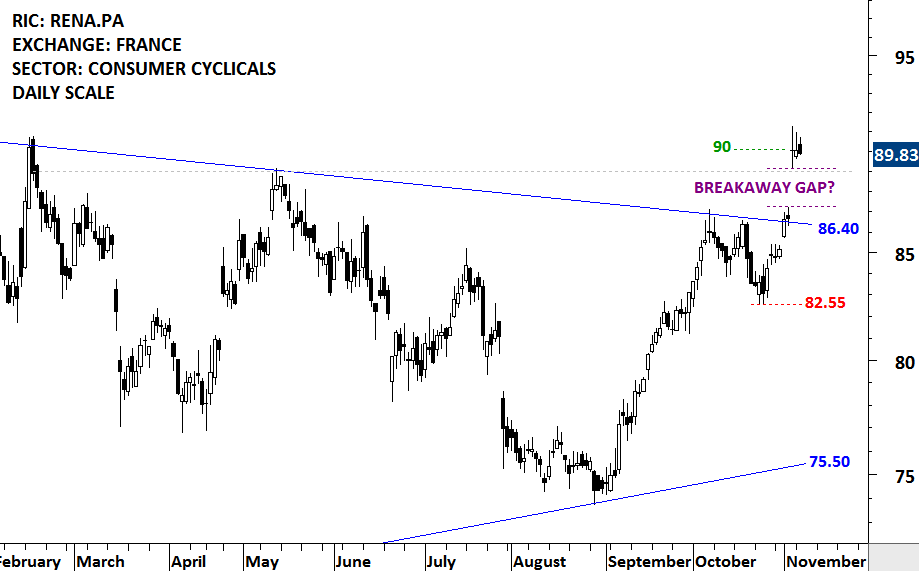
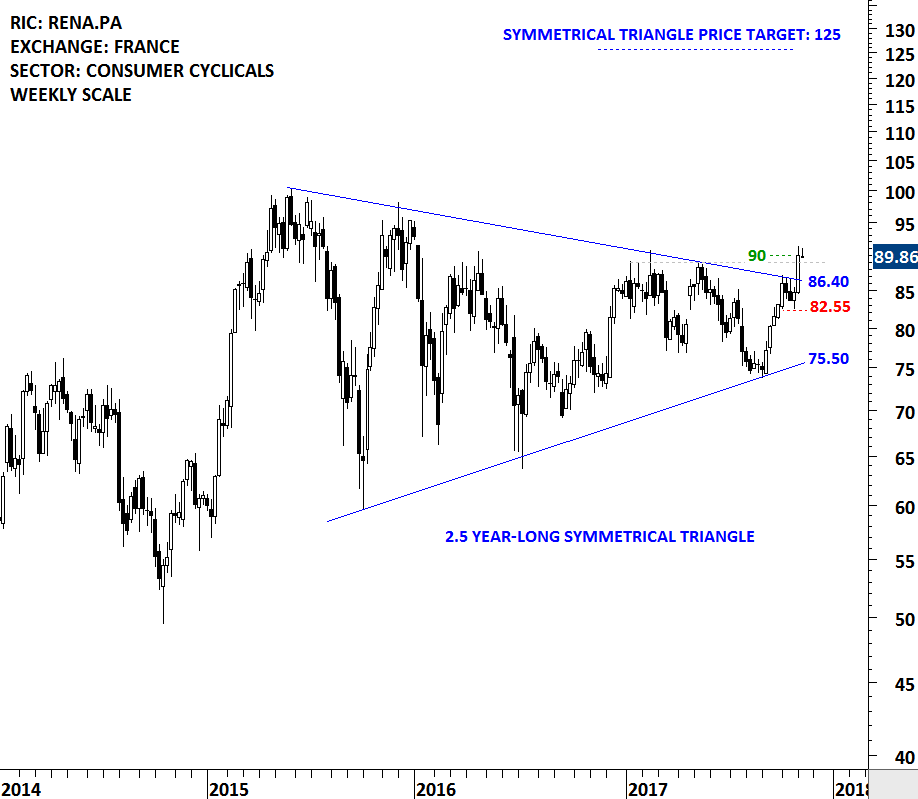
Last week’s strong weekly price action on RENAULT SA completed a multi-year symmetrical triangle. On the daily scale chart the breakout took place with a gap opening above the multi-year trend resistance. We can possibly identify the gap as a breakaway gap which could have significant long-term implications. Breakaway gaps are rarely filled and they usually signal a change in trend.
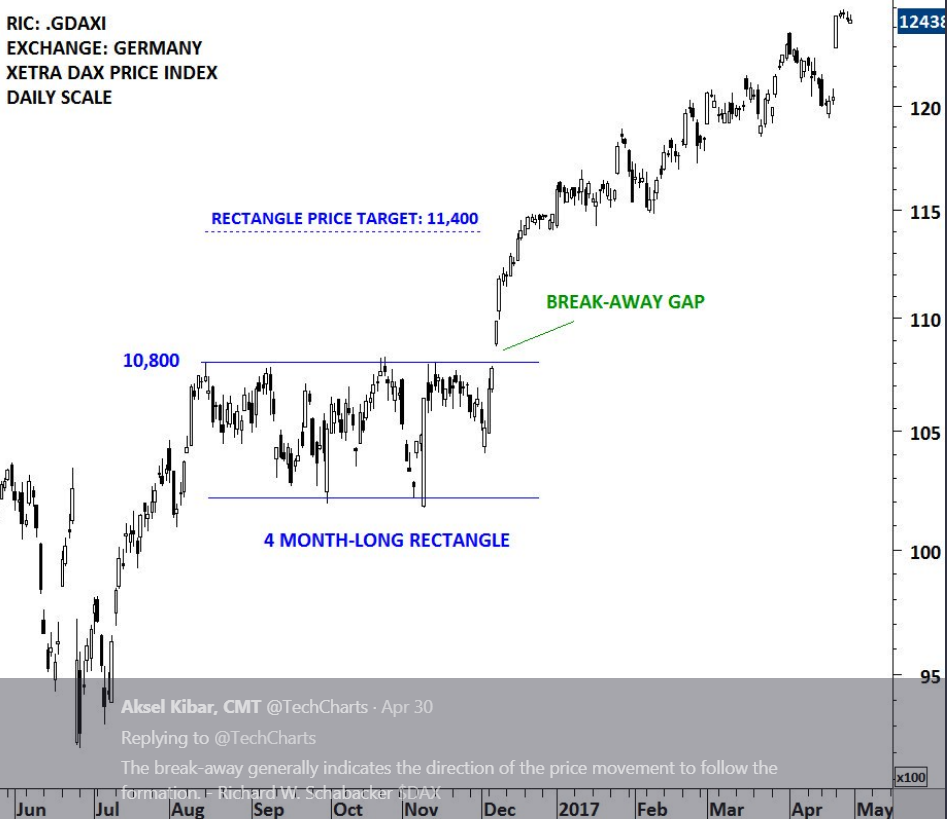
The breakout on the daily scale price chart of RENAULT SA reminded me of a similar, though shorter-term breakout that took place on the Germany DAX Index. The breakaway gap that took place in the beginning of December 2016 was not filled. The breakout from the well-defined consolidation range was followed by a strong trend period.
Tech Charts Membership

By becoming a Premium Member, you’ll be able to improve your knowledge of the principles of classical charting.
With this knowledge, you can merge them with your investing system. In fact, some investors use my analyses to modify their existing style to invest more efficiently and successfully.

As a Premium Member of Aksel Kibar’s Tech Charts,
You will receive:
-
Global Equities Report. Delivered weekly.
-
Classical charting principles. Learn patterns and setups.
-
Actionable information. Worldwide indices and stocks of interest.
-
Risk management advice. The important trading points of each chart.
-
Information on breakout opportunities. Identify the ones you want to take action on.
-
Video tutorials. How patterns form and why they succeed or fail.
-
Watch list alerts. As they become available so you can act quickly.
-
Breakout alerts. Usually once a week.
-
Access to everything (now and as it becomes available)o Reports
o Videos and video series -
Multi-part webinar course. You learn the 8 most common charting principles.
-
Webinars. Actionable and timely advice on breaking out chart patterns.
For your convenience your membership auto renews each year.


