BREAKOUT ROOM SEPT 1, 2026 – LIVE MEETING, CHARTS Q&A (Recording)
BREAKOUT ROOM SEPT 1, 2026 - LIVE MEETING, CHARTS Q&A (Recording)
Meeting Outline
- Q&A on charts of your interest
This author has not written his bio yet.
But we are proud to say that Aksel Kibar contributed 1514 entries already.
Meeting Outline
BTCUSD broke its resistance at 67.2K resistance after rebounding from support at 60K. ETH/BTC shows signs of strength by completing a short-term bottom reversal. Breakout from the channel favors ETH over BTC in the short-term.
Meeting Outline
Tech Charts Members,
We continue with our Breakout Room meetings to discuss charts of your interest. This meeting's scheduling targets Americas & Europe members. I will share my screen and will pull up chart of your request and review patterns and opportunities from the perspective of classical charting principles. We had several meetings that were a success and we got the chance to review so much in the allocated time. I hope this time as well we will cover as many charts and questions as possible.
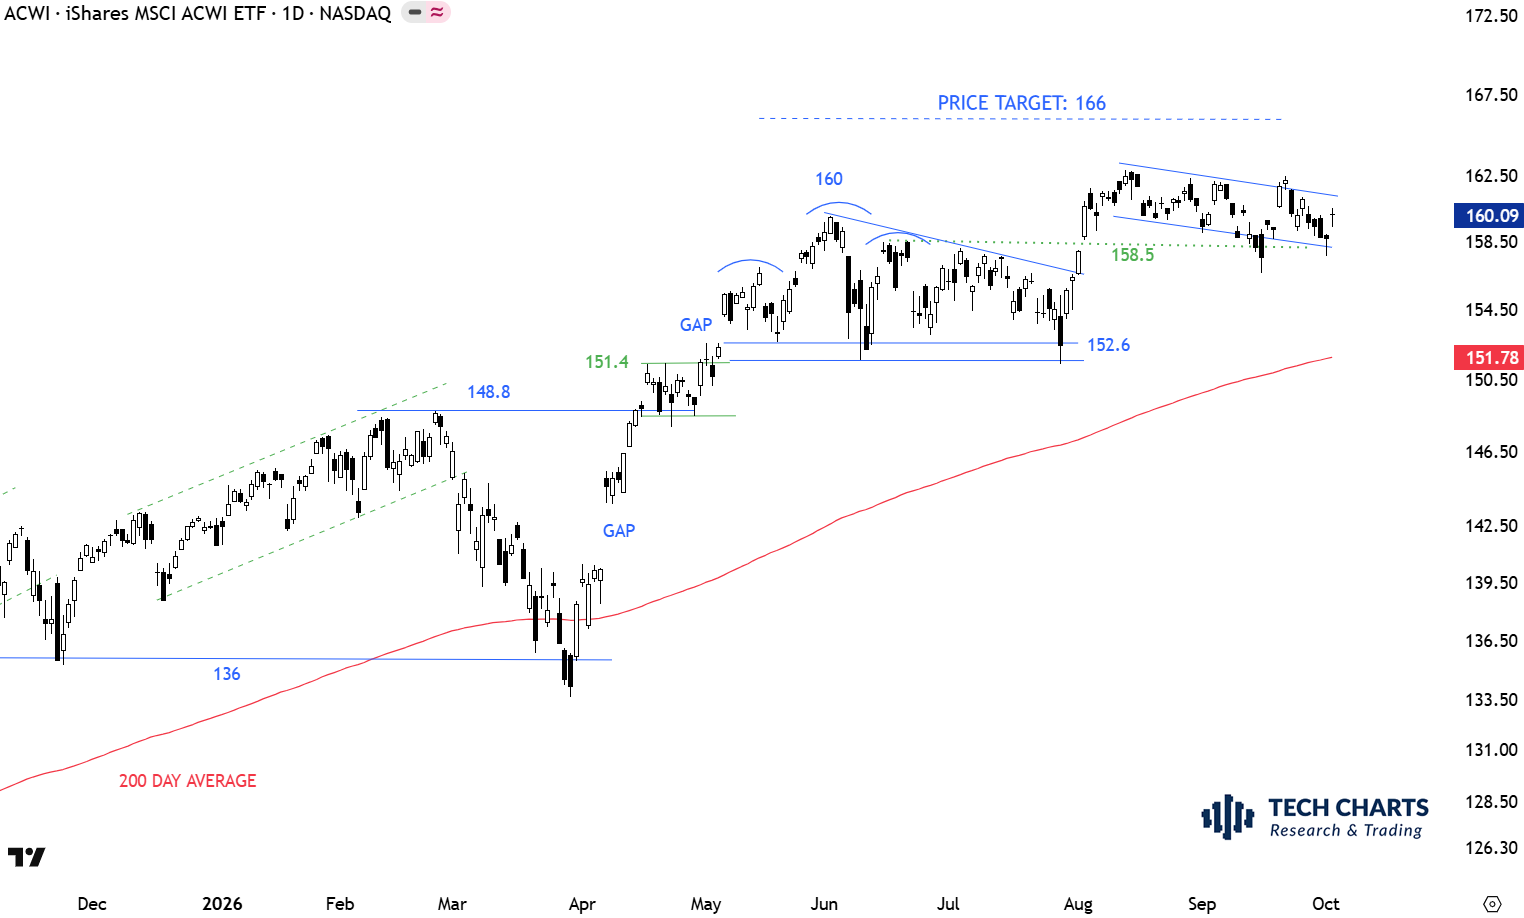
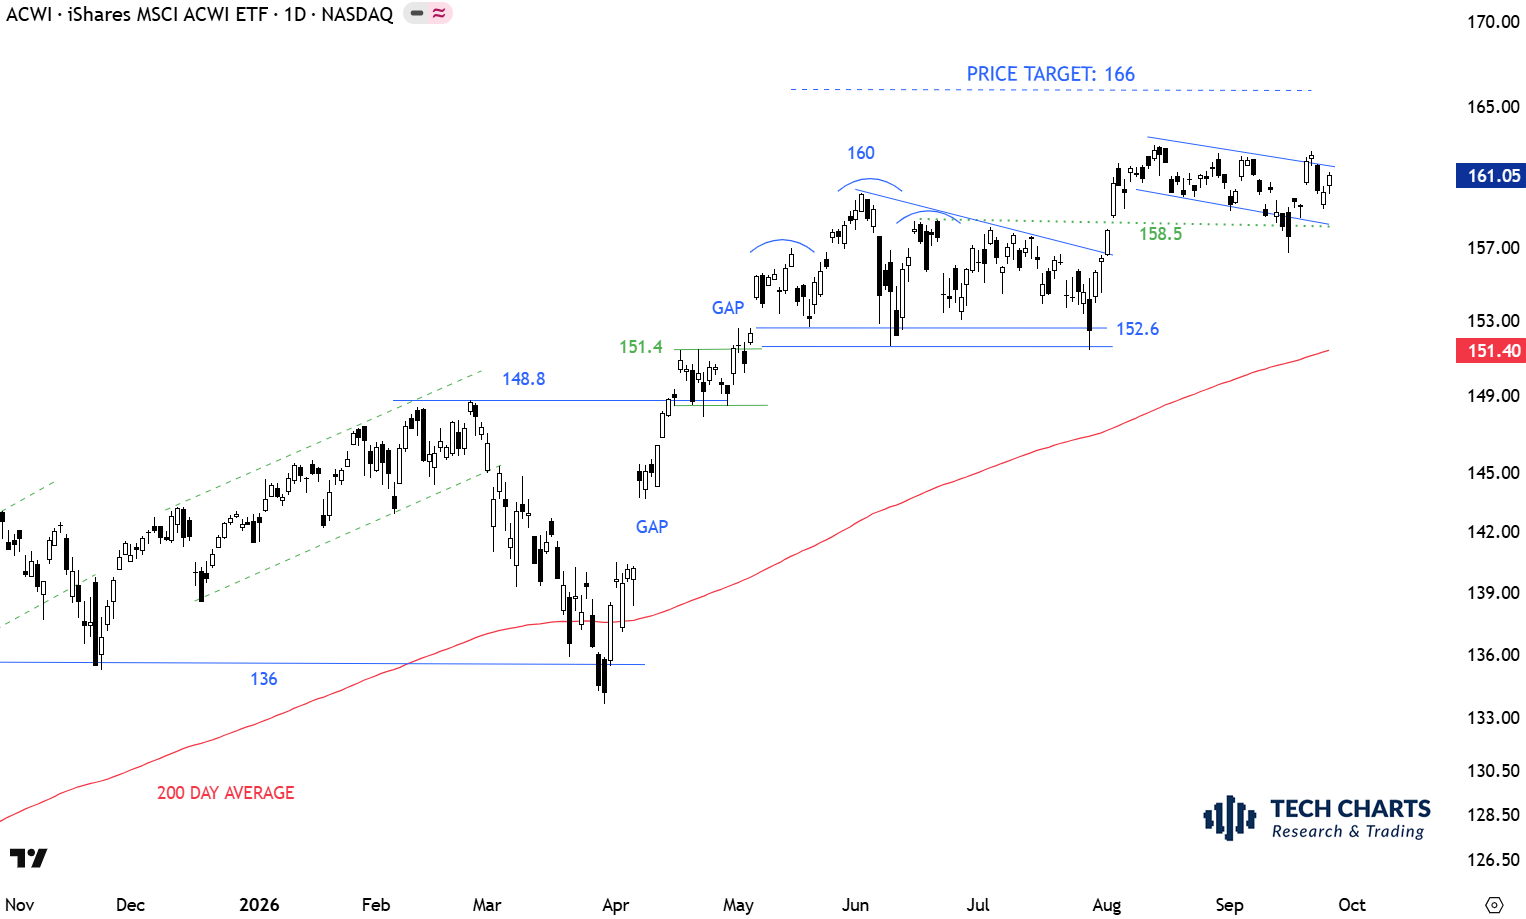
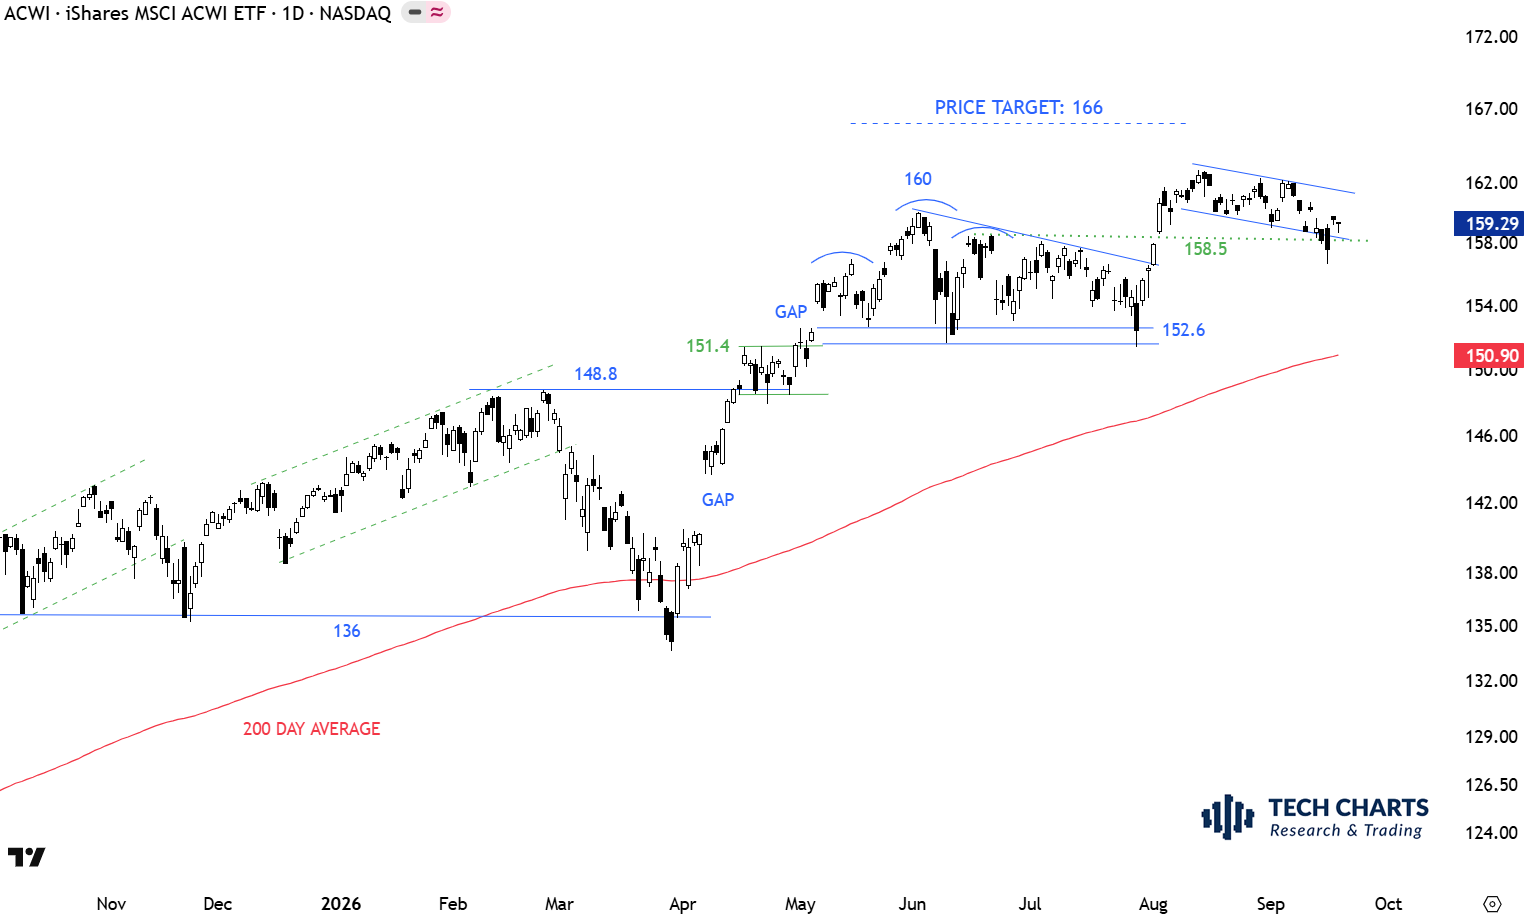
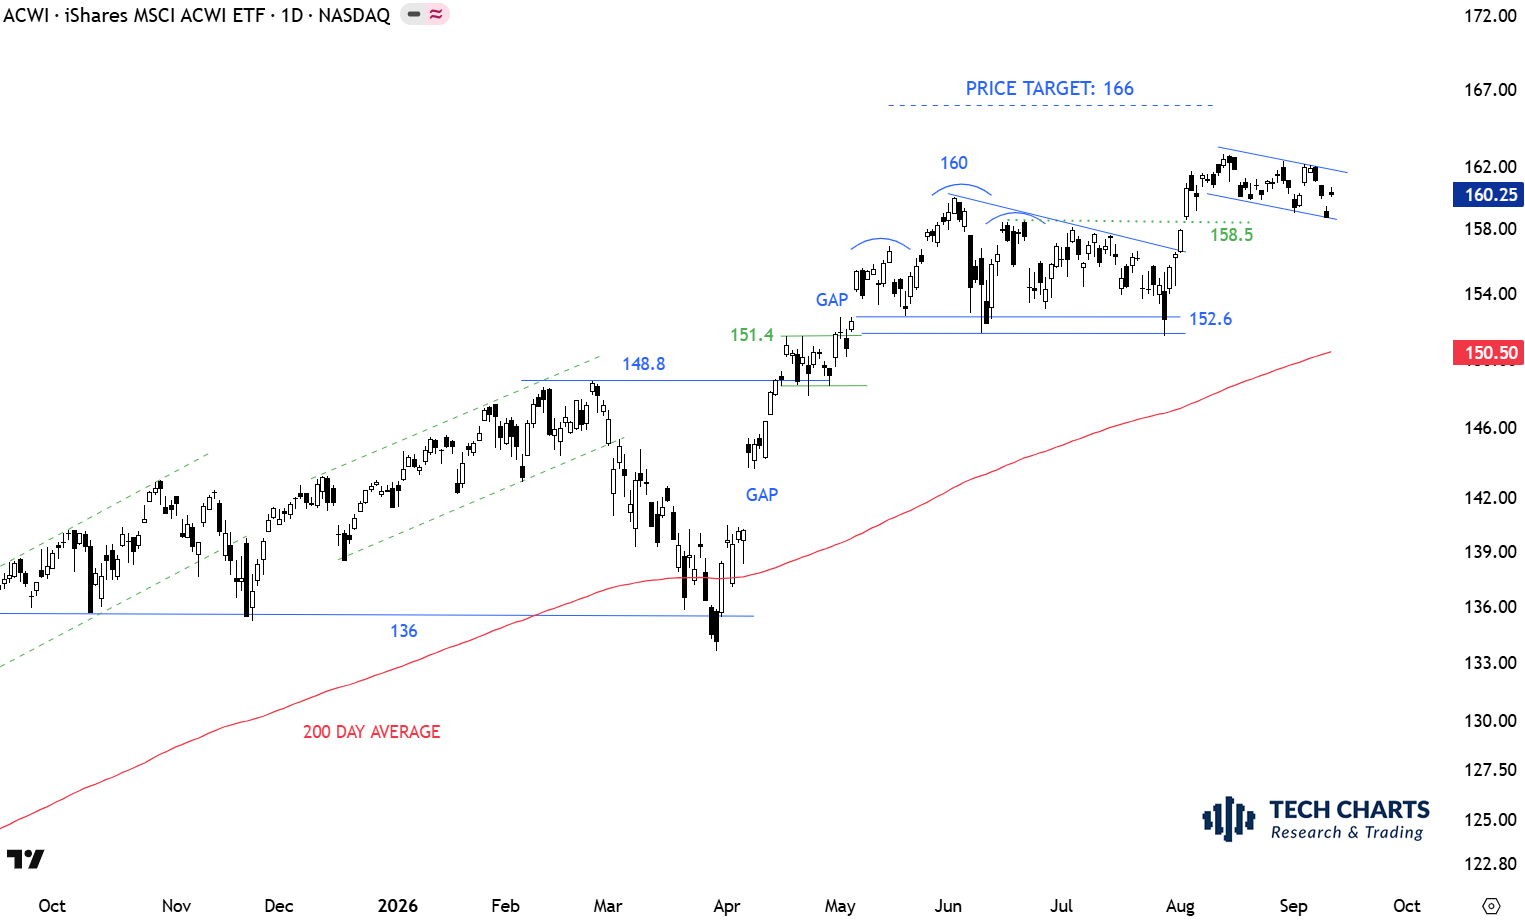
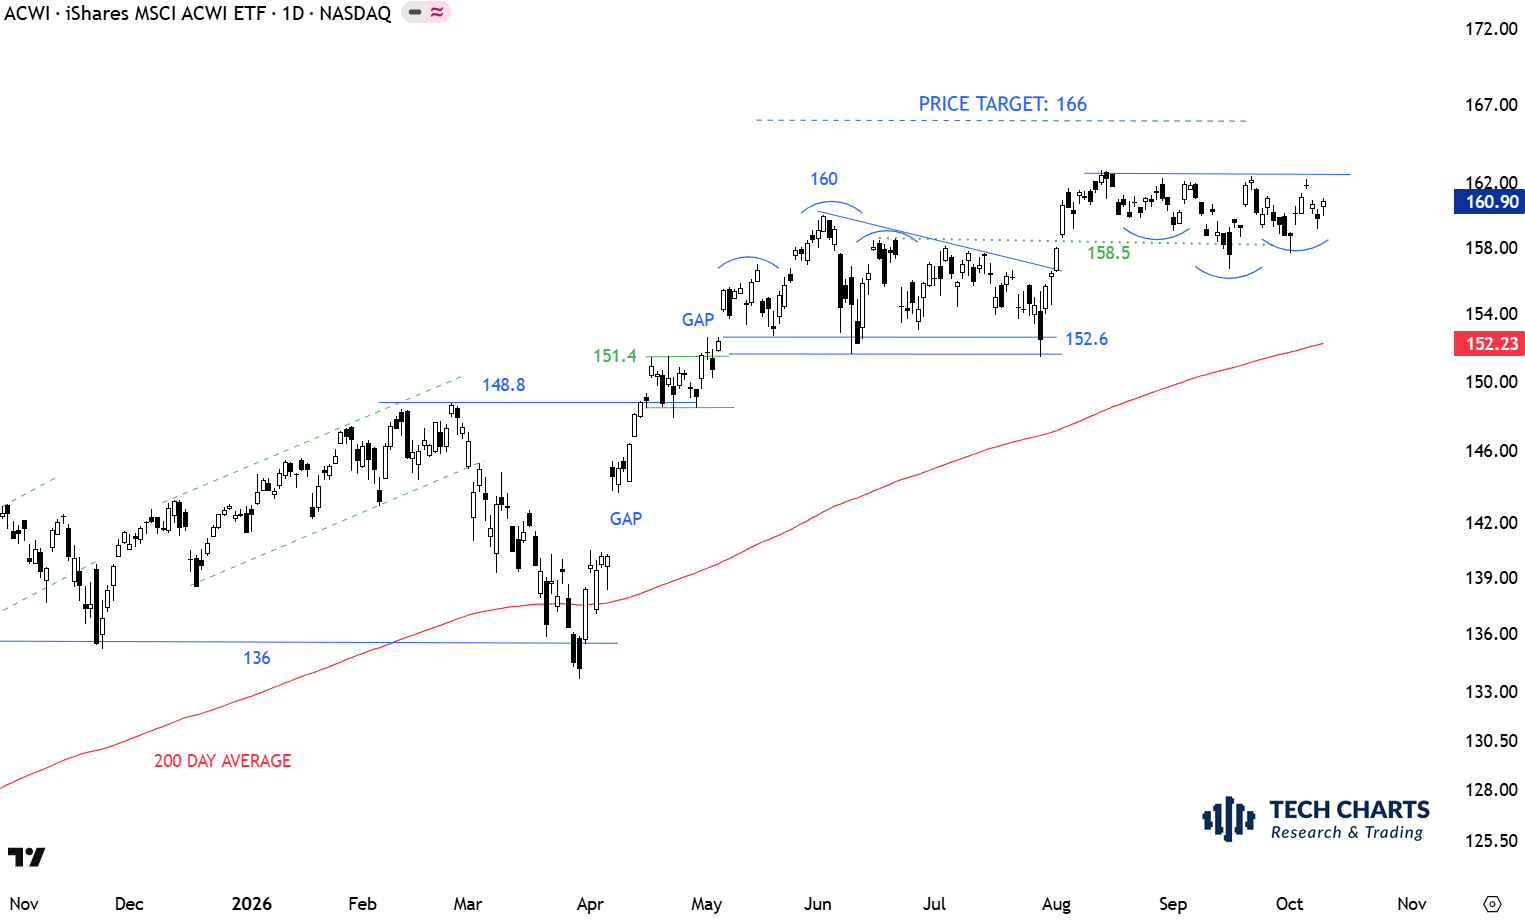
The benchmark for the Global equity markets performance, the iShares MSCI All Country World Index ETF (ACWI.O) is trading well above its 200-day average at 149.56 levels. Breakout above 158.5 levels is resuming the uptrend above the long-term average. The benchmark possibly completed a H&S failure with the breach of the highest level for the right shoulder. Price target for the H&S top failure stands at 166 levels. 160-158.5 area becomes the new short-term support.
The benchmark for the Global equity markets performance, the iShares MSCI All Country World Index ETF (ACWI.O) is trading well above its 200-day average at 148.97 levels. Breakout above 158.5 levels is resuming the uptrend above the long-term average. The benchmark possibly completed a H&S failure with the breach of the highest level for the right shoulder. Price target for the H&S top failure stands at 166 levels. 160-158.5 area becomes the new short-term support.

BTCUSD tests its resistance at 67.2K resistance after rebounding from support at 60K. ETH/BTC shows signs of strength by completing a short-term bottom reversal. Breakout from the channel favors ETH over BTC in the short-term.
The benchmark for the Global equity markets performance, the iShares MSCI All Country World Index ETF (ACWI.O) is trading well above its 200-day average at 148.37 levels. Breakout above 158.5 levels is resuming the uptrend above the long-term average. The benchmark possibly completed a H&S failure with the breach of the highest level for the right shoulder. Price target for the H&S top failure stands at 166 levels. 160-158.5 area becomes the new short-term support.
The benchmark for the Global equity markets performance, the iShares MSCI All Country World Index ETF (ACWI.O) is trading well above its 200-day average at 147.7 levels. Breakout above 158.5 levels is resuming the uptrend above the long-term average. The benchmark possibly completed a H&S failure with the breach of the highest level for the right shoulder. Price target for the H&S top failure stands at 166 levels. 152.6-158.5 area becomes the new support.
The benchmark for the Global equity markets performance, the iShares MSCI All Country World Index ETF (ACWI.O) is trading well above its 200-day average at 147 levels. Breakdown below 152.6 levels can complete a short-term top and can become part of a reversion to the mean. Bearish chart pattern completions above the long-term averages are more prone to failure as they take place against the overall trend. This week's reversal from the support was strong. Chart pattern is morphing. A breakout above 158.5 levels can resume uptrend above the long-term average.
BTCUSD tests its resistance at 67.2K resistance after rebounding from support at 60K. ETH/BTC shows signs of strength by completing a short-term bottom reversal. Breakout from the channel favors ETH over BTC in the short-term.