Entries by Aksel Kibar

A Framework for Classifying Chart Pattern Breakouts

Extending Peter Brandt's Last Full Day Low Rule: A Framework for Classifying Chart Pattern Breakouts


Introduction

Peter Brandt is widely recognized for his disciplined approach to classical chart pattern trading. While much attention is given to identifying chart patterns and measuring price objectives, Brandt places equal importance on trade management and risk control. One of the cornerstones of his methodology is the Last Full Day (LFD) Low Rule, which provides an objective reference point for managing risk immediately after a breakout.

Beyond its application as a protective stop, the Last Full Day Low can also serve as an effective tool for evaluating the quality of a breakout. By observing how price behaves relative to this level after a breakout, chart patterns can be classified into four distinct categories ranging from high-momentum breakouts to complete failures.

This article combines Brandt's original concept with a systematic breakout classification framework.

Read More

GLOBAL EQUITY MARKETS – July 11, 2026

REVIEW


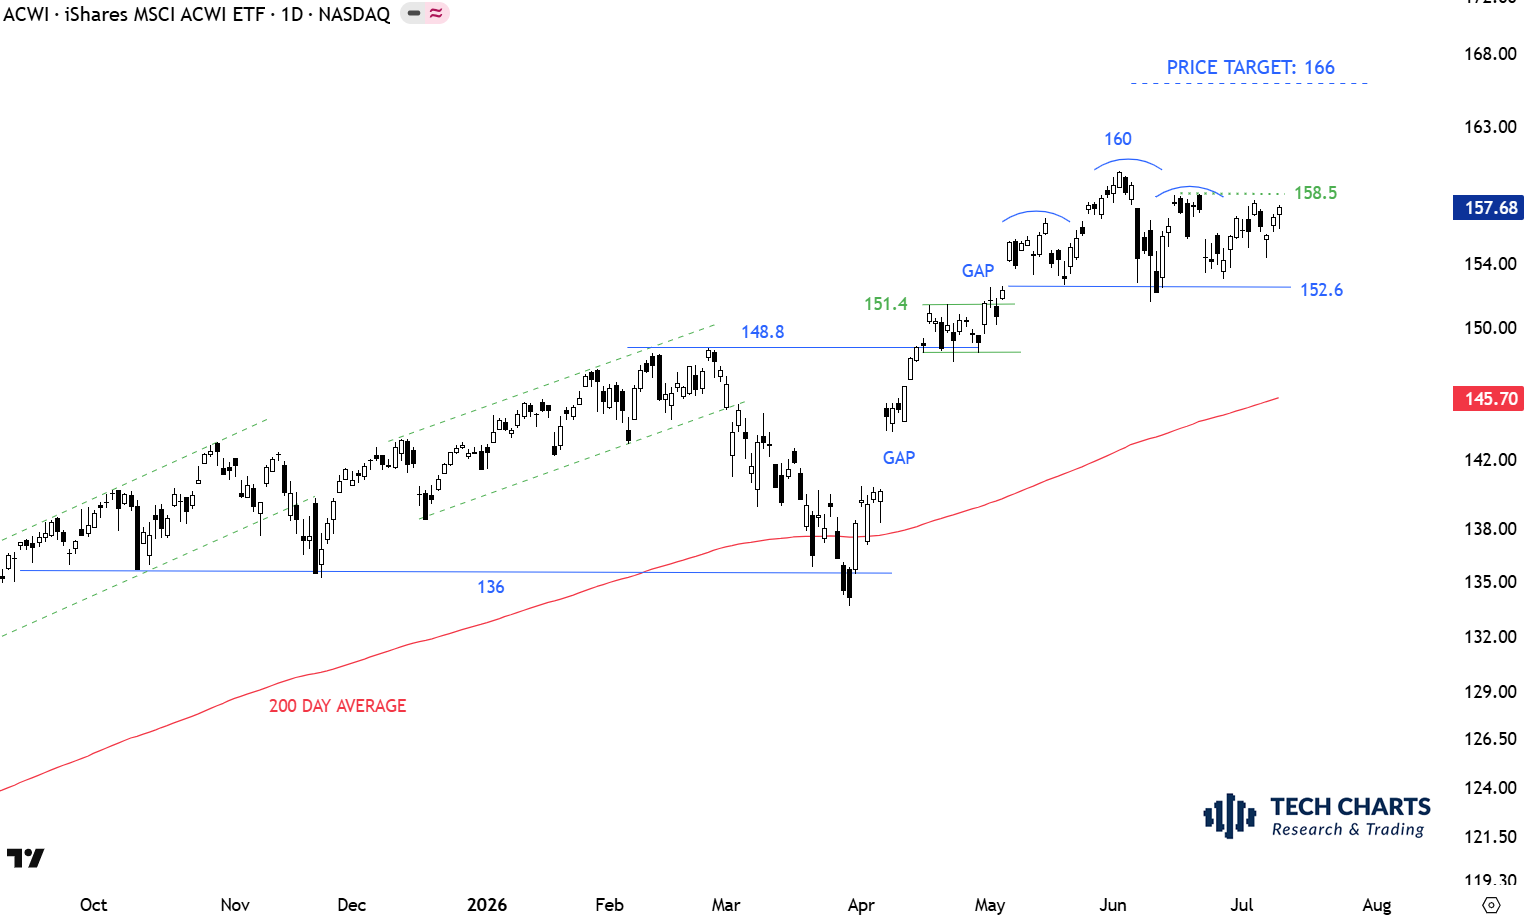
The benchmark for the Global equity markets performance, the iShares MSCI All Country World Index ETF (ACWI.O) is trading well above its 200-day average at 145.7. The gap above 151.4 was filled during short-term weakness. Breakdown below 152.6 levels can complete a short-term top and can become part of a reversion to the mean. Bearish chart pattern completions above the long-term averages are more prone to failure as they take place against the overall trend. Breach of the high of right shoulder at 158.5 can result in a H&S top failure and offer a long signal with the price target of 166 levels. With the last two week's price action, I'm leaning more towards the possibility of a H&S top failure and the continuation of the existing uptrend.
 

Read More

GLOBAL EQUITY MARKETS – July 4, 2026

REVIEW


The benchmark for the Global equity markets performance, the iShares MSCI All Country World Index ETF (ACWI.O) is trading well above its 200-day average at 144.67. The gap above 151.4 was filled during short-term weakness. Breakdown below 152.6 levels can complete a short-term top and can become part of a reversion to the mean. Bearish chart pattern completions above the long-term averages are more prone to failure as they take place against the overall trend. Breach of the high of right shoulder at 158.5 can result in a H&S top failure and offer a long signal with the price target of 166 levels.


Read More

GLOBAL EQUITY MARKETS – June 27, 2026

REVIEW


The benchmark for the Global equity markets performance, the iShares MSCI All Country World Index ETF (ACWI.O) is trading well above its 200-day average at 144.67. The gap above 151.4 was filled during short-term weakness. This week's sell-off tested the short-term support at 152.6 levels which is the neckline of a possible short-term H&S top. Breakdown below 152.6 levels can complete a short-term top and can become part of a reversion to the mean. Bearish chart pattern completions above the long-term averages are more prone to failure as they take place against the overall trend. Breach of the high of right shoulder at 158.5 can result in a H&S top failure and offer a long signal.


Read More

GLOBAL EQUITY MARKETS – June 20, 2026

REVIEW


The benchmark for the Global equity markets performance, the iShares MSCI All Country World Index ETF (ACWI.O) is trading well above its 200-day average at 144.14. The gap above 151.4 was filled during short-term weakness. Last week's sell-off tested the short-term support at 152.6 levels which is the level the ETF rebounded after filling the gap. There is no top reversal chart pattern on daily scale price chart. A possible short-term H&S top can develop if the ETF stalls at current levels and rolls over towards the support at 152.6. Such price action can form the right shoulder of a short-term H&S top. For now we can conclude that the uptrend is intact. Next short-term resistance is at 160 levels.


Read More

INTERIM UPDATE – June 19, 2026

After reviewing several daily end of day charts and weekly charts from the weekend research, these opportunities from Global Equities are worth bringing to your attention as they get closer to breakout levels and can confirm chart pattern setups before the week finalizes. These charts will be discussed in the weekend report as well with additional setups from Americas. 

Read More

BREAKOUT ROOM THURSDAY 18th of June 9:00 AM EEST (Eastern European Summer Time) – LIVE MEETING, CHARTS Q&A

BREAKOUT ROOM THURSDAY 18th of June 9:00 AM EEST (Eastern European Summer Time) - LIVE MEETING, CHARTS Q&A

Meeting Outline

  • Q&A on charts of your interest

Tech Charts Members,

We continue with our Breakout Room meetings to discuss charts of your interest. Due to our diverse geographical members base we will have 2 different breakout rooms in different time zones. Next week's meeting will target Americas & Europe members. This meeting is scheduled for Asia & MEA members. I will share my screen and will pull up chart of your request and review patterns and opportunities from the perspective of classical charting principles. We had several meetings that were a success and we got the chance to review so much in the allocated time. I hope this time as well we will cover as many charts and questions as possible.

Read More