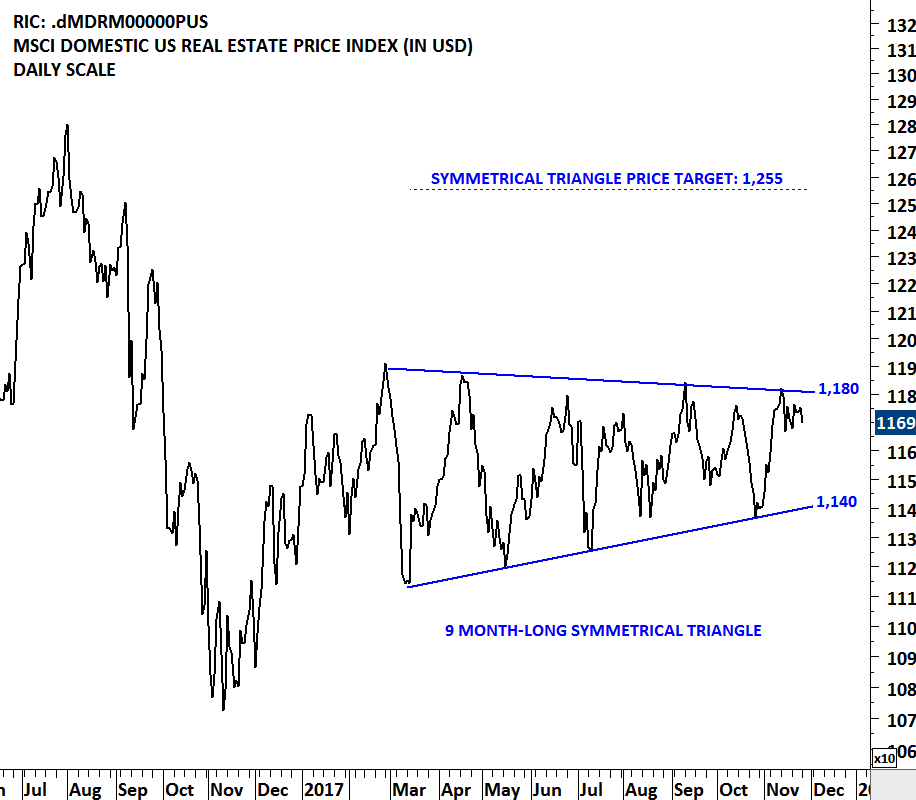
MSCI DOMESTIC U.S. REAL ESTATE PRICE INDEX
The MSCI Domestic U.S. Real Estate Index and related REIT ETFs are going through a lengthy consolidation. Breakouts from tight and lengthy consolidations are usually followed by strong directional movement. Price index respected the boundaries of the 9 month-long symmetrical triangle. Both boundaries were tested several times over the past months. The upper boundary of the possible symmetrical triangle is acting as resistance at 1,180 levels and the lower boundary as support at 1,140 levels. A decisive breakout above 1,180 levels will confirm the symmetrical triangle as a bullish continuation with a possible chart pattern price target of 1,255 levels.
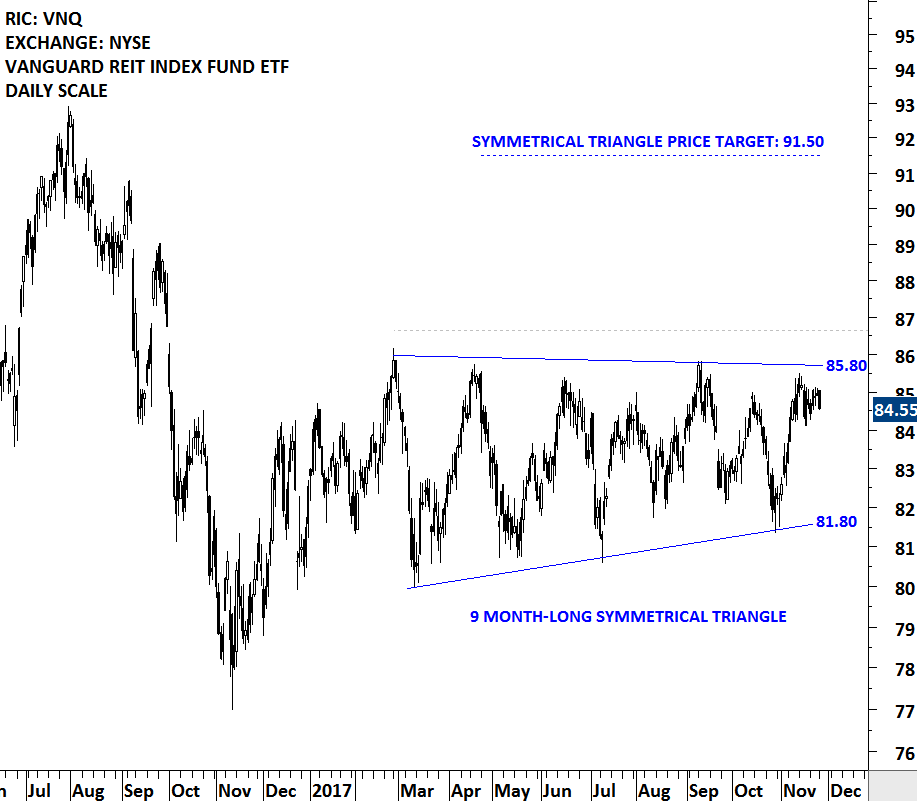
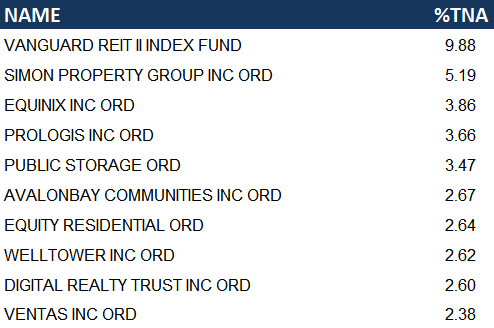
Vanguard REIT Index Fund (VNQ) seeks to provide a high level of income and moderate long-term capital appreciation. The Fund employs an indexing investment approach designed to track the performance of the MSCI US REIT Index. The Index is composed of stocks of publicly traded equity real estate investment trusts (known as REITs). The table below shows the top 10 holdings of the ETF as of 31 October 2017. The ETF is listed on the New York Stock Exchange. Price chart formed a 9 month-long symmetrical triangle with the upper boundary acting as resistance at 85.80 levels. A daily close above 86.65 levels will confirm the breakout from the lengthy sideways consolidation with a possible price target of 91.50 levels.
Vanguard REIT Index Fund (VNQ) top 10 holdings as of 31 October 2017
Tech Charts Membership

By becoming a Premium Member, you’ll be able to improve your knowledge of the principles of classical charting.
With this knowledge, you can merge them with your investing system. In fact, some investors use my analyses to modify their existing style to invest more efficiently and successfully.

As a Premium Member of Aksel Kibar’s Tech Charts,
You will receive:
-
Global Equities Report. Delivered weekly.
-
Classical charting principles. Learn patterns and setups.
-
Actionable information. Worldwide indices and stocks of interest.
-
Risk management advice. The important trading points of each chart.
-
Information on breakout opportunities. Identify the ones you want to take action on.
-
Video tutorials. How patterns form and why they succeed or fail.
-
Watch list alerts. As they become available so you can act quickly.
-
Breakout alerts. Usually once a week.
-
Access to everything (now and as it becomes available)o Reports
o Videos and video series -
Multi-part webinar course. You learn the 8 most common charting principles.
-
Webinars. Actionable and timely advice on breaking out chart patterns.
For your convenience your membership auto renews each year.


