STOXX 50, NIKKEI and FTSE 100

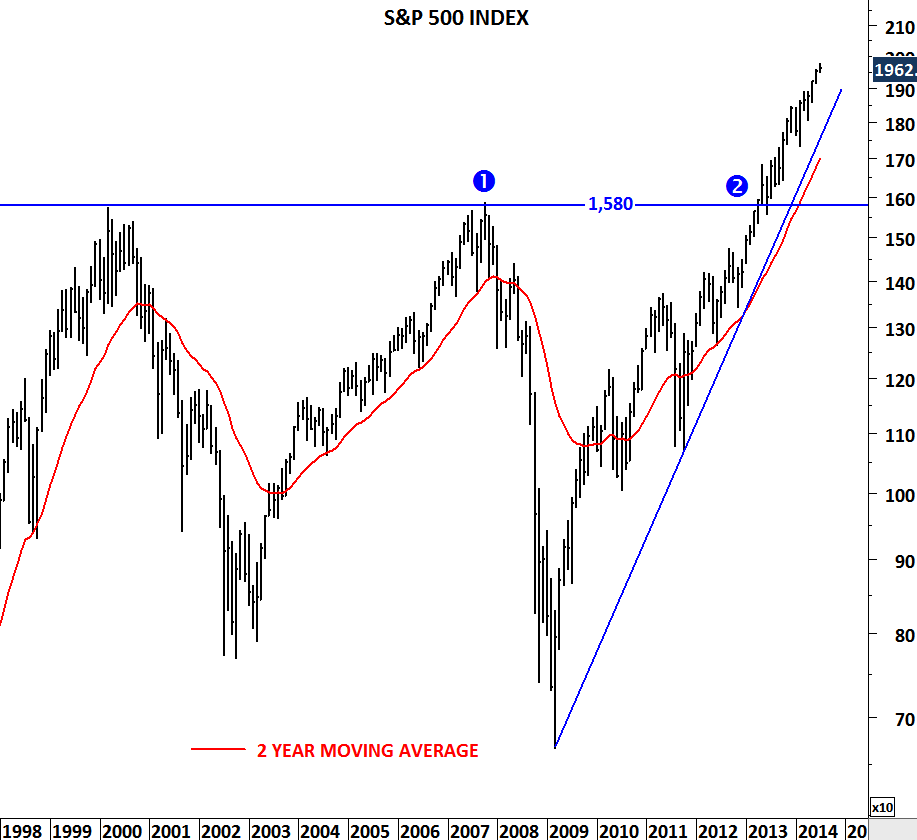
Global equity markets are at a critical juncture. Most of the major equity benchmarks are testing multi-year trend resistances. These are decade-long trend lines and if they are broken on the upside, it will signal further equity market strength for coming years.

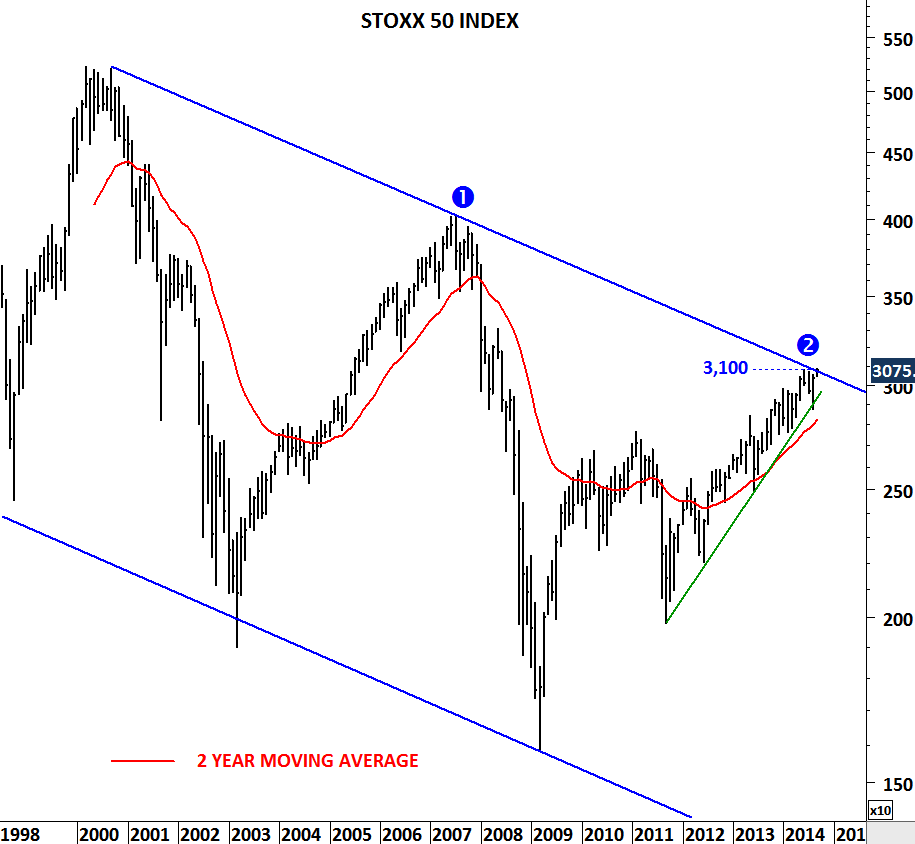
STOXX 50 (includes UK companies), an equity benchmark for Europe, is testing 14 year-long trend resistance at 3,100 levels. While breakout would require a significant amount of energy (either positive news flow or expectation of positive economic outlook in the Euro zone), such price action (a decisive break above 3,100) will be extremely bullish for the European equities.

STOXX 50 INDEX

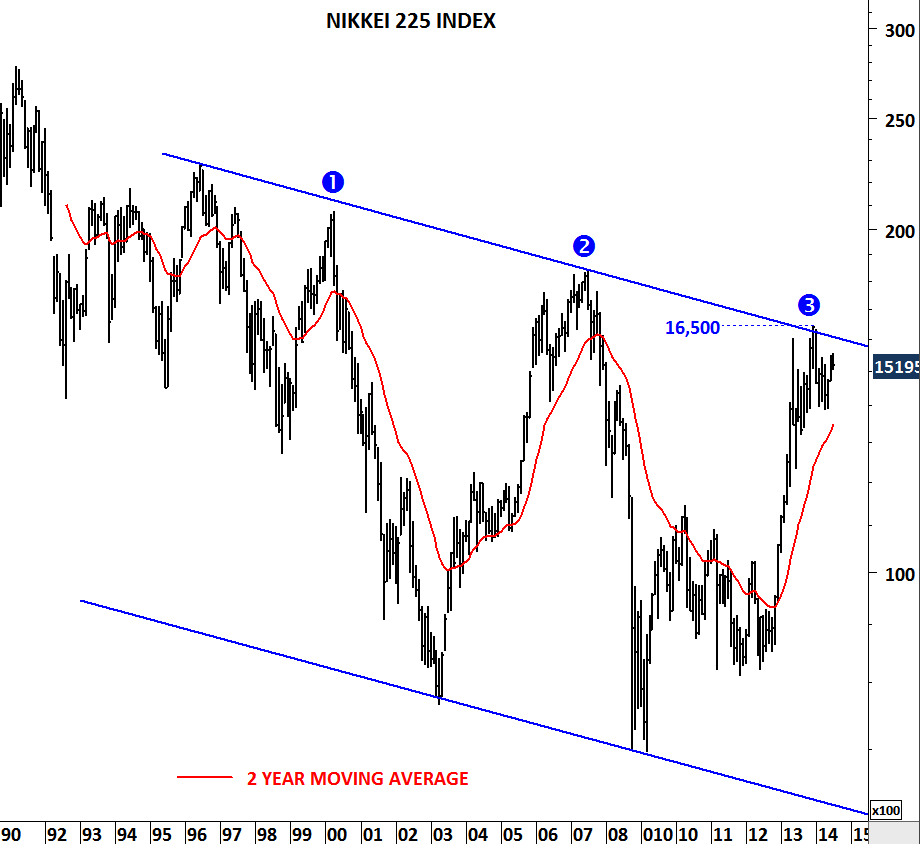
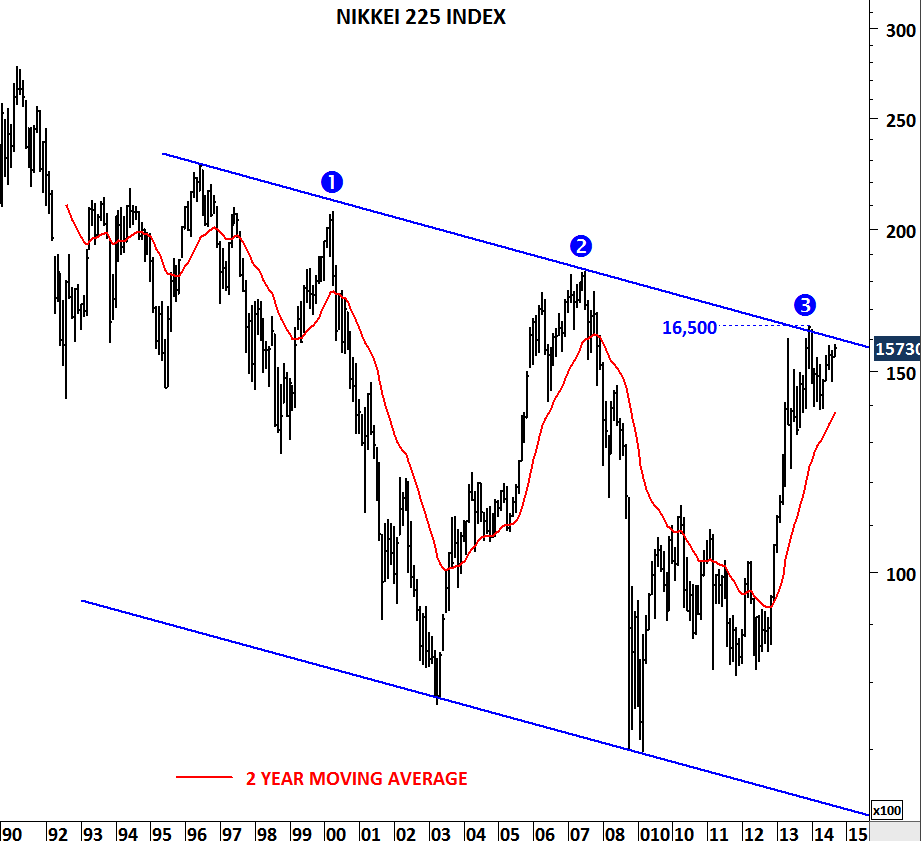
Japan’s Nikkei 225 index is testing a 20 year-long trend resistance at 16,500 levels. Decisive break above the strong multi-decade resistance will be extremely positive for the Japanese equities.

NIKKEI 225 INDEX

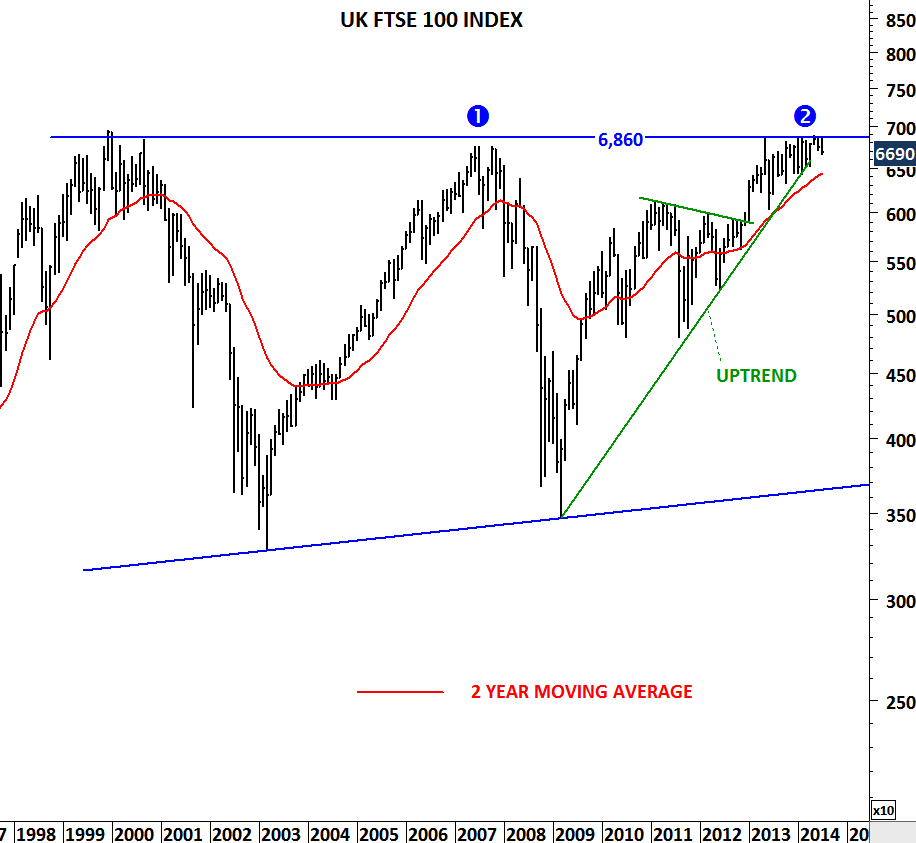
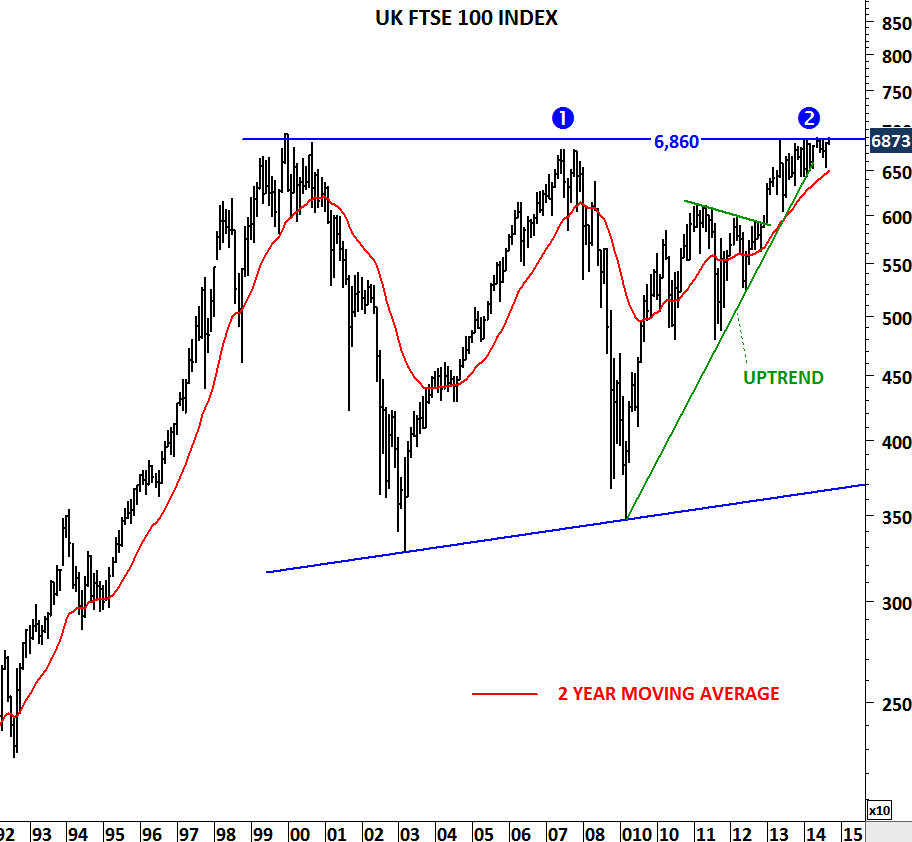
UK’s FTSE 100 index is now challenging historical high levels at 6,860. Breakout above the multi-decade horizontal resistance will also be a bullish signal for the global equity markets.

UK FTSE 100 INDEX

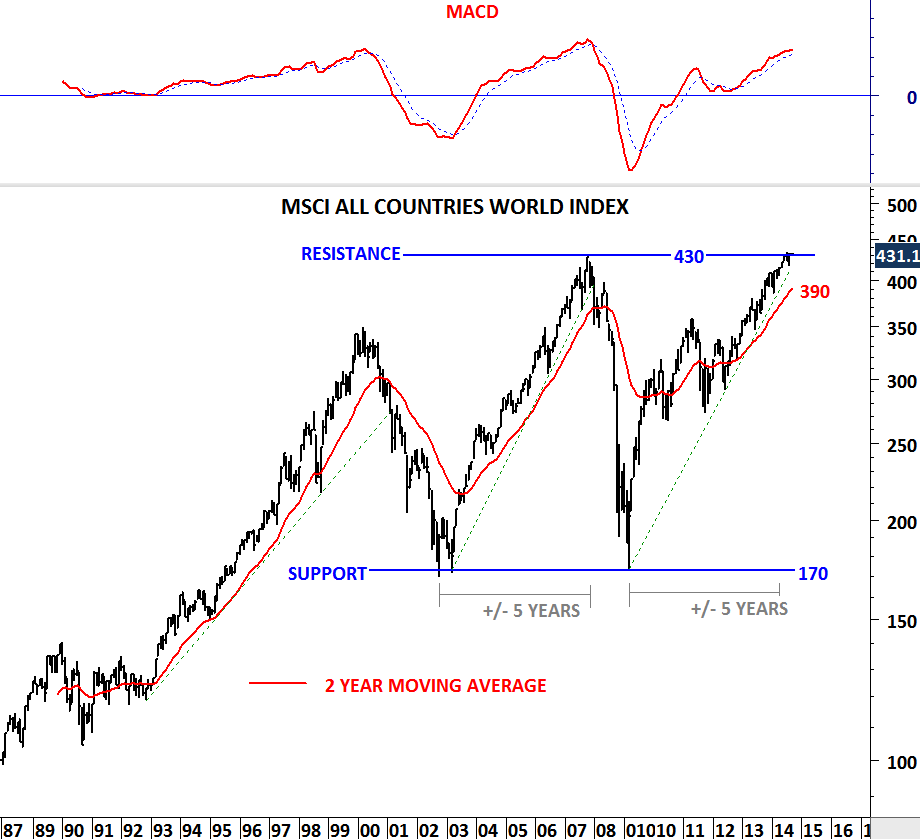
Last but not least, MSCI ALL COUNTRIES WORLD INDEX, which is a broad representation of global equity market performance is challenging historical high levels.

MSCI ALL COUNTRIES WORLD INDEX

HANG SENG INDEX

Over the past 4 years, China has been an under-performer. Chinese equity market has clearly lagged the global recovery. Though, poor performance can end soon. Several Chinese companies are listed in Hong Kong and the Hang Seng Index is ready to breakout from a flat range. Hang Seng index is pushing above strong resistance area between 24,000-25,000. Next price target could be the upper boundary of the trend channel at 28,000 levels.

HONG KONG HANG SENG INDEX

U.S. DOLLAR INDEX

Dollar is gaining strength against major currencies. Recent breakout on the U.S. dollar index confirms this. Other than Euro and Japanese yen weakness we are also seeing depreciation in emerging market currencies. Combined weakening effect of the developed and emerging market currencies resulted in a sharp price movement on the U.S. dollar index. Latest breakout above 81.60 completed a “double bottom” chart pattern with a price target of 84-85 area for the coming weeks. Price should remain above 81.60 levels for the dollar strength to resume in the medium-term. 81.60 becomes the new support level.

US DOLLAR INDEX

Some exciting chart developments are taking place in the emerging market currencies. Peruvian Nuevo Sol; local currency of Peru is losing strength against the U.S. dollar. Latest chart development – ascending triangle on the weekly scale – is bullish for the dollar and suggests further depreciation of the Peruvian Nuevo Sol. Breakout above 2.82 levels will confirm the bearish case for PEN.

USDPEN

Another currency pair that is at the edge of a breakout is the Russian Ruble. Since the beginning of 2009 USD/RUB tested 36.50 for the third time. Breakout above 36.50 will be negative for the Russian currency. It is important to note that 36.50 is the historical high for the USD/RUB.

USDRUB

GOLD

Year-long consolidation in Gold prices  should end soon. A strong trend period should follow once the symmetrical triangle is resolved in one direction. Volatility has decreased on weekly scale and this increased the likelihood of high volatility period in the following weeks/months. Boundaries of the consolidation stand at 1,270 and 1,360 levels. Breakout above 1,360-1,400 area will push gold price higher towards 1,525 levels. Breakdown below 1,250-1,270 support area will result in another downtrend towards 1,150 levels.

GOLD

U.S. HOUSING STARTS

U.S. housing starts was down another 9.3 percent in June after declining 7.3 percent in May. Latest figure stands at 893,000. Here is why we should actually pay close attention to 840,000 levels in the following months. Yes, technical analysis can also be applied to economic time series. Anything that is a product of human interaction in free markets is a subject of technical analysis and this historical chart on U.S. housing starts clearly shows the boundaries of the supply  and demand.

US HOUSING STARTS

Over the past half-century U.S. housing starts fluctuated between 2.2 million and 840,000 with one exception during the sub-prime mortgage crisis. Because the housing market was the epicenter of the financial melt-down during the 2007-2009 decline, housing starts data inevitably undershoot the 840K levels. Since October 2012, housing starts are above the historical threshold. For the housing market recovery to remain intact, housing starts should hold above 840K levels.

TAIWAN WEIGHTED INDEX

Taiwan still needs to prove itself. However, sooner or later breakout from this long-term chart pattern will present tremendous opportunity. 24 year-long sideways consolidation might be close to completion. Breakout should be powerful and preferably once confirmed this market shouldn’t look back. There are two more resistance levels that I will be following and these are 9,700 and 10,350 levels. Taiwan is an emerging market that must be on your watch list.

TAIWAN WEIGHTED INDEX

S&P 500, STOXX 50, NIKKEI and FTSE 100

S&P 500 index cleared its historical high level at 1,580 levels. U.S. equities have clearly outperformed the rest of the global equity markets. So far so good… But without Japan, Europe and UK how far can the positive trend in equities reach? Long-term charts show that Stoxx 50, Nikkei 225 and FTSE 100 indices have reached strong long-term resistance levels. Only after a breakout above these long-term resistances will global equities have more fuel to resume their long-term uptrend. Failure to breakout from these consolidations in the following months can be negative for equity markets.

S&P 500 INDEX

EURO STOXX 50

NIKKEI 225 INDEX

UK FTSE 100 INDEX

PLATINUM

After a long consolidation period, Platinum might be preparing for a strong breakout. Since the beginning of 2014, Platinum price has been forming higher highs and a horizontal resistance. Strong horizontal resistance area remain between 1,470 and 1,490. Breakout above the resistance area can push prices higher towards 1,550-1,600 range.

PLATINUM

Another interesting chart development can be seen on Platinum Group Metals – an equity listed in NYSE. Stock has formed a perfect symmetrical triangle. Strength in Platinum can result in a breakout on this long-term chart pattern. In the following weeks I will keep an eye on precious metals and especially on Platinum.

PLATINUM GROUP METALS

GERMANY BUND

Bond prices are rising again. German government bonds are looking strong as Bund futures prepare for a breakout from a 2 year-long consolidation range. Since mid-2012 German Bund has been consolidating between 137 and 147 levels. Prices are now testing the strong resistance at 147 levels for the 4th time. Breakout above 147 can result in a multi-month strength in German government bonds. Breakouts from flat consolidation ranges are powerful and are usually followed by trend periods.  Failure to close decisively above 147 levels can result in further consolidation between 137 and 147.

Monthly scale chart

BUND MONTHLY

Weekly scale chart

BUND WEEKLY

BRENT CRUDE OIL

While you are reading this post please note that I’m not basing my decision-making and my analysis on the latest developments in middle east. I’ve been analyzing Brent crude and the energy sector for some time. Earlier analysis (May 17, 2014 / Mar 29, 2014 / Mar 3, 2014) suggested a strong directional move that is likely to develop. Low volatility periods are usually followed by high volatility and vice versa. Brent Crude oil and energy sector has been consolidating for more than 2 years in a very tight range. This resulted in a historical low volatility. In other words “calm before the storm”. Breakouts from these type of low volatility trading ranges are usually very powerful. This was the basic assumption that I based my analysis on. Latest developments in the middle east can be a trigger for higher prices (still to be seen). Rather than focusing on the short-term news effect I would like to draw your attention to the larger scale breakout that can take place in the energy sector. As I have mentioned in my earlier updates, energy sector is likely to be the hot topic in the second half of the year.


BNO

ETFS BRENT

BRENT CRUDE OIL