GLOBAL EQUITY MARKETS – September 30, 2017

REVIEW


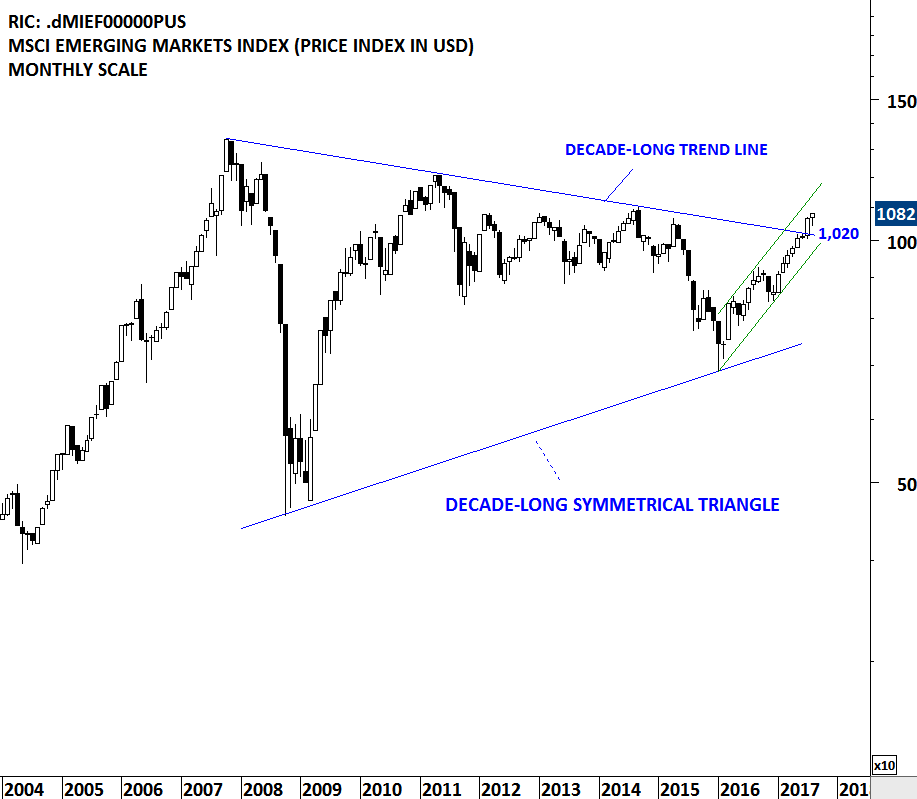
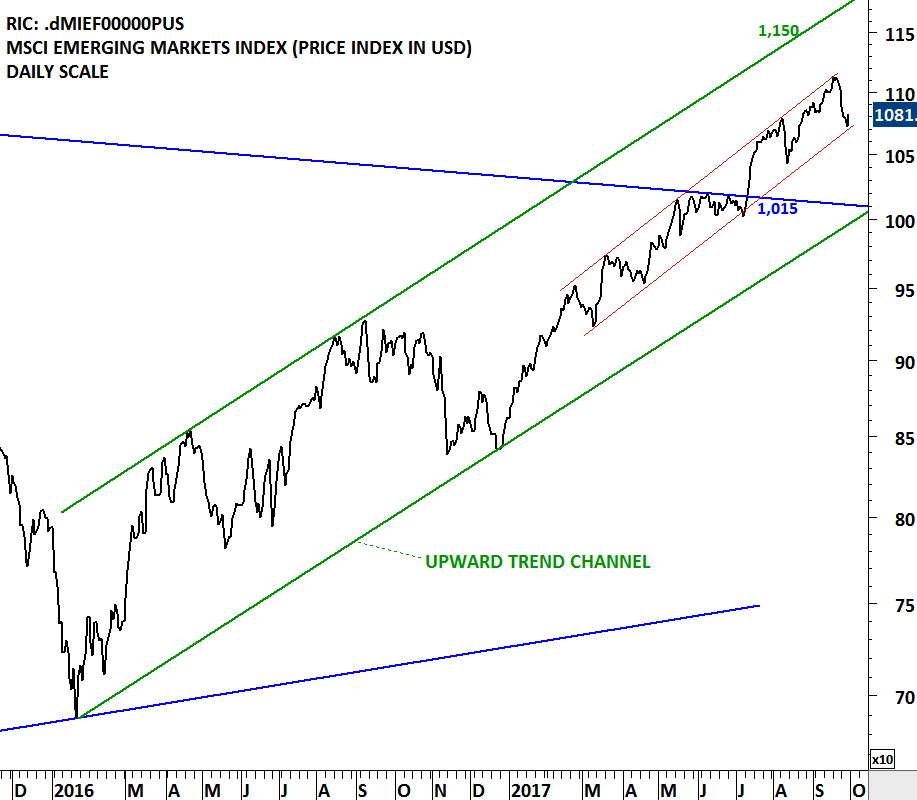
Uptrend remains intact for the emerging markets index. MSCI Emerging Markets Index cleared decade-long trend resistance at 1,015 levels and continues to trend higher. Strong support remains between 1,000 and 1,015 levels. Last one week's pull back is possibly finding support at the lower boundary of the year-long upward trend channel. Weekly candlestick pattern (hammer) on iShares MSCI Emerging Markets Index ETF (EEM) is featured in the following chart. Hammer candlestick pattern at support area can signal a bullish reversal.

Read More

Factor LLC and Tech Charts Member Webinar – September 2017

Member Webinar and Q&A with Peter L. Brandt and Aksel Kibar - Recorded live September 21, 2017

Opening discussion/presentation by Peter and Aksel 

  • Favorite classical chart patterns
  • Establishing timing of entry and targets
  • Current markets

Live questions from Members  

  1. Peter: Do you track prices of rice separately or is it included in the grains chart that you already are tracking? 46:02
  2. Aksel: How important is the volume when price break out from the chart pattern? Is it more reliable with higher volume in your opinion? 47:01
  3. Either: CS - (as an example) You pull up a chart on interactive brokers, big charts, metastock, etc., and you get different break out resistance lines — what is the “official" chart? 48:23
  4. Peter: Since I traded more in India, can you please tell what is the strongest sector that can be played for nifty move up to 11250? 50:54
  5. Aksel: What risk management / trade management rules of thumbs do you apply when trading? 51:41
  6. Both: From observing your trades/recommendations you seem to have a different time frame for your ideal trade setups (10-26 weeks vs 4-24 months) — would be curious to understand if this is a function of the different markets you trade or if you just have different experiences with the reliability of time frames or something else? 52:51
  7. Both: Neither of you use volume in your analysis, to confirm breakouts , etc., can you talk a little bit about why you don't use it, especially for stocks Aksel as volume is more readily available there compared to forex. 54:54
  8. Peter: Can the right shoulder in gold chart morph into an abbreviated one and thus making it breakout powerfully?  What is the reason for you to have the H&S to be symmetrical in case of gold? 58:13
  9. Aksel: I have a general question concerning the neckline of HS-Formation. I noticed the neckline/boundary can be horizontal, and diagonal as well. Is that of any significance? 1:00:12
  10. Either: With regard to futures the successful patterns are 12-16 weeks long. In light of having to wait for the “right" patterns as a trader are you not significantly limiting yourself in building significant equity due to the few opportunities that emerges. 1:00:52
  11. Either: What do you see as the pros and cons of using CFDs for trading stocks? And is it an instrument your recommend using? 1:02:42
  12. Either: If a flag/pennant correction after a previous move, where you ideally enter and set the stop loss? 1:04:10
  13. Peter: You mentioned the tactical challenges in trading 1-2 year patterns — would you mind explain how you address these challenges tactically? 1:06:10
  14. Aksel: Do you agree with Peter that profits should be taken when target is met? 1:08:03
  15. Either: Do either of you have a real preference for bars over candles and why? 1:09:29
  16. Peter: Do you also watch bar-by-bar in order to identify patterns more accurately. Kind of "tape reading"? I understand you trade the break out, but are you more alert when e.g. bars are more narrow ranged at the moment you think breakout comes? 1:10:25
  17. Either: Where do you place initial and subsequent stops on BO? What do you consider too late a BO entry? 1:11:18
  18. Either: There are so many great trade set up ideas provided for in your chart analysis.  Practically when managing capital, you are constrained by the number of trades that you can take. How do you manage the process of selecting the "best trades" and what criteria do you use to define those? 1:14:06
  Read More

GLOBAL EQUITY MARKETS – September 23, 2017

REVIEW


Another Emerging Asia equity index broke out to new all-time highs. Philippines SE Composite index breached the 8,125 level after moving in a 2 year-long, wide trading range between 6,500 and 8,125 levels. The equity benchmark has been in a steady uptrend for the past year. Last two week's price action cleared the strong horizontal resistance and pushed the index to uncharted territory. Once a strong resistance, 8,125 level now acts as support. As long as the index holds above that level we will expect positive momentum to continue in the Philippine Stock Exchange. An efficient way to take advantage of the recent bullish technical development in the Emerging Asian country is through iShares MSCI Philippines ETF (EPHE.K) that is listed on the New York Stock Exchange. The chart below reviews the iShares MSCI Philippines ETF.

Read More

GLOBAL EQUITY MARKETS – September 16, 2017

REVIEW


Global equity markets continue to remain in a steady uptrend. iShares MSCI All Country World Index, a benchmark for global equity market performance, continued to hold above its multi month-long upward trend line. The minor low and the upward sloping trend line are forming support at 66.15 levels. Uptrend is intact.

Read More

Factor & Tech Charts Member Webinar – Thursday, September 21st at 11am Mountain

Thursday, September 21st at 11:00 am MST

Members of the Factor and/or Tech Charts Service join us for our first joint webinar with Peter Brandt and Aksel Kibar. Peter and Aksel will give examples of major chart patterns. They will discuss current trades that performed well and showcased classical charting patterns. Peter and Aksel will also discuss any current developing trades. As time allows we’ll end with member questions.

Read More

GLOBAL EQUITY MARKETS – September 9, 2017

REVIEW


I am not sure if Volatility index can be analyzed from a classical charting perspective but over the past few months, the VIX futures and since 2016, the CBOE Volatility Index respected important support/resistance levels. Irrespective of the headlines related to geopolitical tensions, the three different continuation future price charts of the Volatility Index (Oct, Nov, Dec) are showing signs of multi-month bottoming process. The importance of 15-16 area as a resistance can be seen on the Volatility Index and the VIX futures price charts. Last one month's price action arguably formed tight consolidations in the form of a pennant/symmetrical triangle below the important horizontal resistance. I think we should keep a close eye on these charts in the coming weeks. Completion of the month-long tight consolidation range can result in a breakout above the strong resistance area between 15 and 16 levels.

Read More

GLOBAL EQUITY MARKETS – September 2, 2017

REVIEW


The iShares MSCI ACWI ETF seeks to track the investment results of an index composed of large and mid-capitalization developed and emerging market equities. It is a good measure of Global equity markets performance. The ETF is listed on the Nasdaq Stock Exchange. Over the past few weeks, the Global Equity Markets report reviewed the ACWI ETF and highlighted the importance of the multi-month uptrend and the trend line support. Last two week's price action rebounded from the steep trend line support at 66.10 levels and challenged the all-time highs. The long-term up trend is still intact and the multi-month trend support has become even more important. The more a technical level is tested the more important that level becomes. For now, our conclusion is that, the benchmark for global equity market performance is still moving higher with an important support (minor low and multi-month upward  trend line) standing at at 66.10 levels.

Read More

INTERIM UPDATE – August 29, 2017

When I started expanding the research and investment universe of Tech Charts back in 2011, it was my intention to offer members and followers a broad perspective on global financial markets opportunities from a classical charting point of view. Today, most of the financial markets are accessible via prime brokers, local brokers or dual listed equities (depository receipts) and Exchange Traded Funds (ETFs). Traders and investors find value in diversifying their portfolios in different asset classes as well as different geographies. The info graphic below highlights the importance of having a global perspective in financial markets research  and investment.


Data source: www.visualcapitalist.com Read More

GLOBAL EQUITY MARKETS – August 26, 2017

REVIEW


Strong weekly performance of the Chinese SSE Composite Index is worth mentioning in this weeks update. Strength in the Chinese equities helped MSCI Emerging Markets Index to remain resilient during the last few week's of global equity market weakness. MSCI Emerging Markets index that cleared decade-long trend resistance in July, held on to its earlier gains during the month of  August.

Read More