GLOBAL EQUITY MARKETS – January 13, 2018

REVIEW


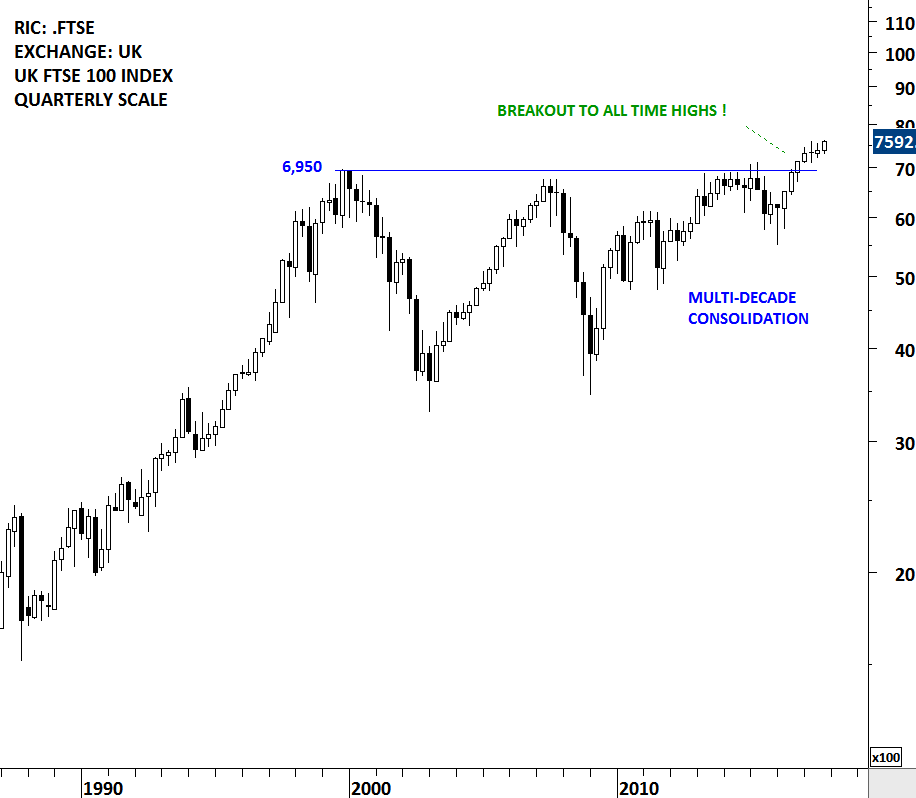
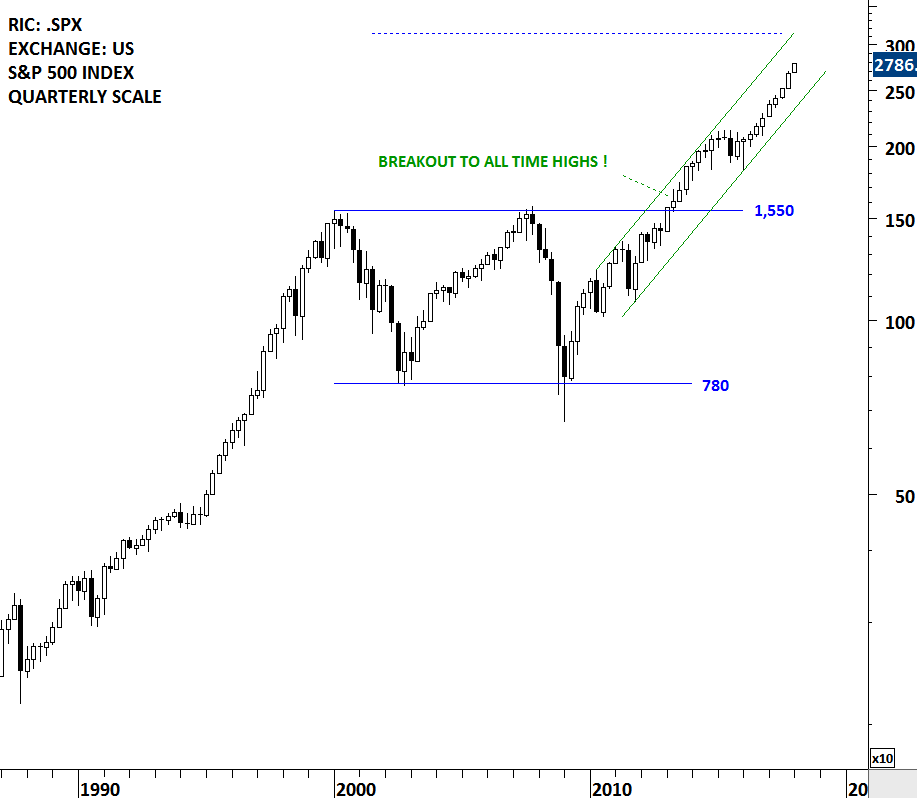
Reviewing long-term charts usually helps us to be focused on the big picture. Due to day to day volatility we might lose sight of the forest for the trees. Every now and then I feature these long-term charts to check the status of the bull market in global equities. U.S. equities have been a leader in the bull market. S&P 500 Index was one of the first widely followed U.S. equity benchmark that completed the decade-long consolidation and broke out to all-time highs in 2013. Since then the index has been in a steady uptrend reaching new high ground. Taking the width of the decade long-consolidation and adding it to the breakout level in percentage terms, gives us a price target in the range of 3,000-3,150.

Read More

INTERIM UPDATE – January 11, 2018

Several Basic Materials stocks are performing well with strong breakouts from lengthy consolidation ranges. January 6, 2018 Global Equity Markets report featured Metalurgica Gerdau SA that is listed in Brasil. The stock is dual listed via depository receipt on the New York Stock Exchange. This week's strong price action is completing the multi-month long bullish continuation chart patterns on both listings. This interim update added the NYSE listing.

Read More

GLOBAL EQUITY MARKETS – January 6, 2018

Announcement: I will be speaking at the Dubai Traders Summit organized by MetaStock on April 26th. Over the past decade I worked for institutions in the region, managing funds & portfolios as well as analyzing Emerging and Frontier markets. At this one day event I hope to connect with Tech Charts members & followers, ex-colleagues and fellow traders to discuss some of the best classical chart patterns that helped me in making trading and investment decisions. Registration is free. You can follow this link to register >> DUBAI TRADERS SUMMIT APRIL 26th.

REVIEW


Global Equity Markets started the new year on a high note. Back to back gains pushed the iShares MSCI All Country World Index towards the upper boundary of its upward trend channel. Strong uptrend remains intact. If the year-long upward trend channel is valid, the upper boundary can act as a short-term resistance. There is no chart pattern that would suggest a trend reversal at this point.

Read More

INTERIM UPDATE – January 4, 2018

Over the past few months Tech Charts Global Equity Markets report analyzed the Europe's EURO STOXX BANKING INDEX and discussed the possibility of a sideways consolidation that can be identified as a 7 month-long symmetrical triangle. The index remained in a tight range for the past months. 2017 ended with the Euro Stoxx Banking index testing the lower boundary of its multi-month consolidation and the 200-day (40 week) moving average at 129 levels.

Read More

Rectangle – Bearish Continuation

This content is for members only

GLOBAL EQUITY MARKETS – December 23, 2017

REVIEW


Over the past few weeks I reviewed the UK FTSE 100 index. I believe it is one of the most important long-term opportunity for global equity investors. There are couple of technical developments that I really like about the UK FTSE 100 index chart. First one is that the index cleared its multi-decade long horizontal resistance and reached all-time highs. Stocks or indices that clear long-term resistances and reach all-time highs enter "uncharted territory". Uncharted territory is the path of least resistance. In other words there is no previous price level that the index would find resistance.

Read More

Rectangle Chart Patterns – December 2017 Tech Charts Webinar

Rectangle Chart Patterns - December 2017 Tech Charts Webinar 
  • Rectangle is a reliable chart pattern with horizontal boundaries.
  • Breakouts from chart patterns with horizontal boundaries are more reliable when compared with breakouts from diagonal boundaries
  • 5 important technical points when identifying rectangle chart patterns
  • Importance of several tests of chart pattern boundary before a breakout takes place
  • The broader context of price action and where the rectangle chart pattern forms
  • Rectangle as a launching pattern
  • Long-term chart patterns will launch strong uptrends
  • Breakout above more than one technical resistance is significant
  • Review of all rectangle chart pattern breakouts between May 2017 and December 2017
  • Developing rectangle chart patterns; a review of watchlist candidates
  • Member charts, analysis of Tech Charts members charts
  • Q&A
Live questions from Members  
  1.  Any thoughts on gold? 48:01
  2. Comments on general questions from members 48:59
  3. What charting platform do you use or recommend for Canada? 51:07
  4. Profit target / exit strategy: any views on the most profitable as 1/ exit 2/ half exit, half keep in trade 3/ trailing stop? 52:22
  5. Broker to trade international stock from Canada? 53:48 (Member reply 58:30)
  6. Could you please explain how you proceed to look at a chart? For a beginner, it's often we don't know where to start when looking at a chart. 54:02
  7. Do you use any indicators to support the breakout or avoid fake breakouts like rsi macd etc? 57:20
  8. I am using CMC Markets which is a free platform. How does this compare with Metastock? 58:54
  9. Would you consider an initial trade at the lower boundary of a rect. after it has been tested 3-4 times and held? 1:00:18
  10. Re entry on a pattern failure, are there any parameters you have? 1:01:36
  11. Can you discuss how you calculate the Negation Point? Do you still keep the stock that triggers the Negation Levels / Point in your watch list? 1:01:36
  12. What do you think is the success rate of the weekly rectangle in % (like 60 or 70%)? 1:04:34
  13. Do you keep statistic of triggered breakouts that failed vs successful ones that you posted in a member section? I mean a ratio between them. 1:06:25
  14. Could you talk a little on the Bitcoin chart. 1:07:39
Recorded live 12.14.2017 Read More

INTERIM UPDATE – December 21, 2017

Vale S.A. is a global producer of iron ore and iron ore pellets, key raw materials for steelmaking, and producer of nickel. The Company also produces copper, metallurgical and thermal coal, potash, phosphates and other fertilizer nutrients, manganese ore, ferroalloys, platinum group metals, gold, silver and cobalt. The stock is listed on the Sao Paulo Stock Exchange. It is also listed on the New York Stock Exchange via depository receipts. This interim update features both the Sao Paulo Stock Exchange and NYSE listing.

Read More

GLOBAL EQUITY MARKETS – December 16, 2017

REVIEW


Global Equity Markets continue to remain in a steady uptrend with the iShares MSCI All Country World Index ETF trending higher in a year-long trend channel. The ETF is also holding above the steep 19 month-long trend line. At this point, there is no clear chart pattern that would suggest a top reversal. Uptrend is intact with the minor support standing at 69.4 levels.

Read More