GLOBAL EQUITY MARKETS – August 19, 2017

REVIEW


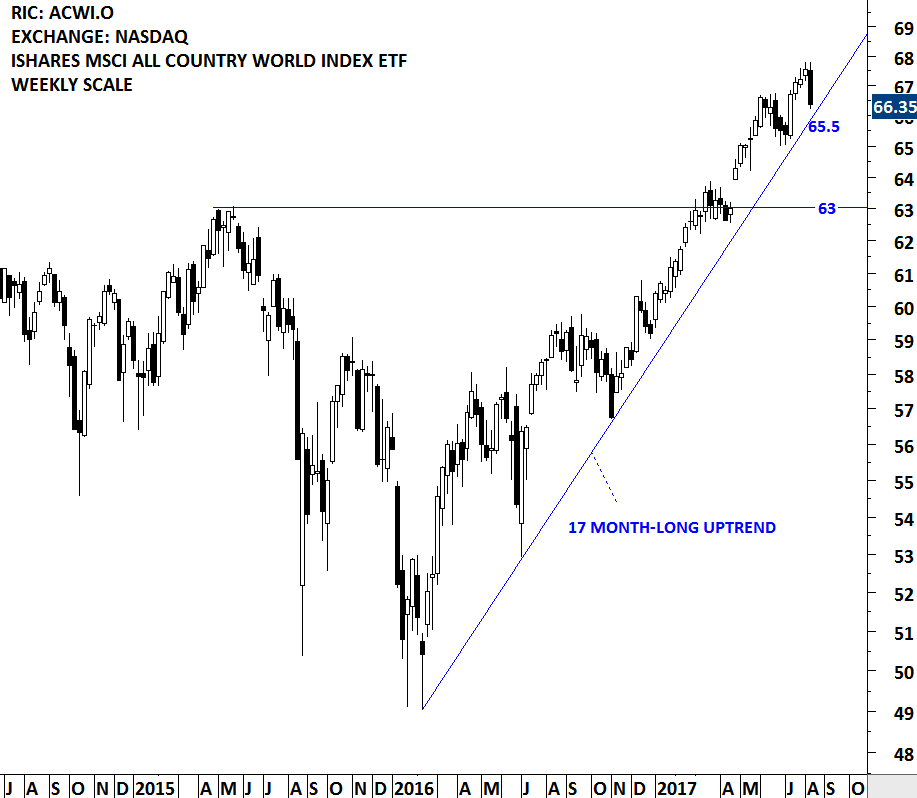
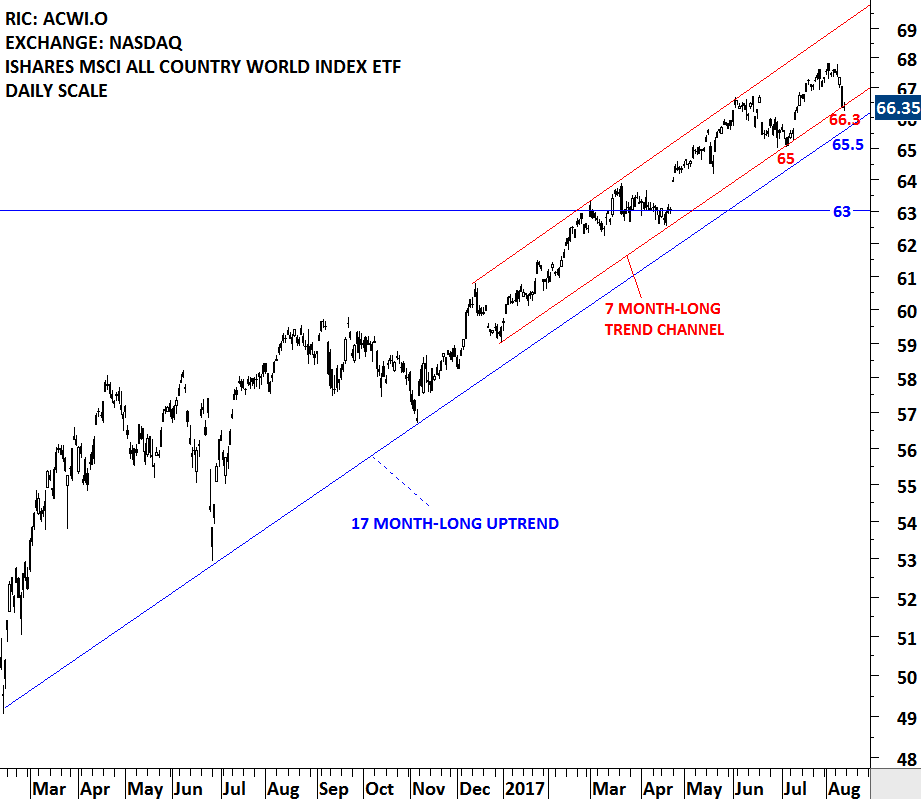
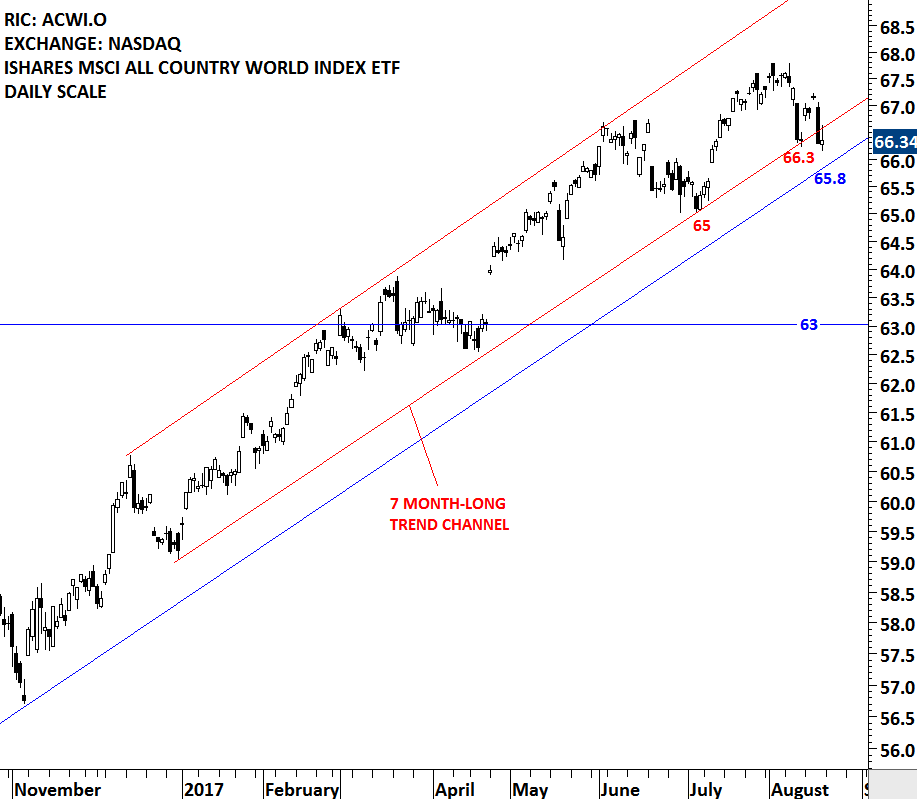
The iShare MSCI ACWI ETF is testing a 17 month-long upward trend line. The more a trend line or a support/resistance area is tested the more important it becomes. The long-term trend line has been tested several times. In the beginning of the week, the global equity benchmark ACWI rebounded from the lower boundary of its 7 month-long trend channel but finished at the same level on Friday. A breakdown below 66.3 levels can push the price towards the long-term trend line support at 65.8. Steep trend lines like the one we are seeing on the ACWI, can't extend for a long time. The trend needs adjustment, in other words find another low. (I added an S&P 500 chart below to better explain this point). The real test will be at 65.8 levels. Breakdown below that support can result in a correction towards 63 levels. Next week, I will be monitoring 66.3 and 65.8 levels closely. Important support area is between 65.8 and 66.3. I will issue interim updates if there is a change in the technical outlook.

Read More

GLOBAL EQUITY MARKETS – August 12, 2017

REVIEW


This week's price action did some technical damage on the charts. MSCI ALL COUNTRY WORLD INDEX ETF, a benchmark for global equity market performance gave back three weeks of gains in one weekly bar. The discussion on the financial networks and social media was about buying the dip. 66.3 is the lower boundary of the 7 month-long trend channel for the ACWI ETF. Failure to hold this support level can push the price to the next support at 65.5, which is the 17 month-long upward trendline. There is no clear chart pattern forming on the MSCI ACWI ETF. For those who are looking for sell signals on the ACWI, the breakdown of the trend channels should give some guidance. In case of further weakness in the global equity markets (a breakdown on the ACWI), this week's report should be helpful in identifying some of the bearish chart setups in the global equities and ETFs.

Read More

INTERIM UPDATE – August 8, 2017

Industrial metals including Copper, Zinc, Nickel and Aluminum are showing strength and strong price action is now reflected on some of the benchmark indices, ETFs and ETNs that track the performance of the industrial metals. Thanks to several Tech Charts members and twitter followers for bringing to my attention the improving outlook in the metals complex.

Bloomberg Commodity indices are some of the benchmarks that I follow. I reviewed some of the chart developments on these indices (discussing several commodity related stocks) back in 2016. Below are some great chart setups that I think might add value to each trader/investors market analysis. Though one should pay close attention to the leverage, liquidity, issuer, counter party risk and many other factors on these OTC or Exchange-listed instruments.

Read More

GLOBAL EQUITY MARKETS – August 5, 2017

REVIEW


South Africa equities are possibly entering into a strong uptrend with the completion of a 2 year-long sideways consolidation. This week's price action breached the multi-year trend resistance on the South Africa All Share index and pushed the local equity benchmark to all-time highs. Breakouts from multi-year consolidations usually result in multi-month trends. 54,600 levels will remain as strong support. Possible chart pattern price target for the South Africa All Share Index stands at 63,700 levels.

There are several tradable ETFs listed on the local exchange and also on the global exchanges. Below is a chart of South Africa listed ETF.

Read More

GLOBAL EQUITY MARKETS – July 29, 2017

REVIEW


Swiss Market Index is possibly preparing for a breakout from its 2 month-long sideways consolidation. Last 2 month's price action can be identified as a symmetrical triangle and it can act as a bullish continuation. The upper boundary of the triangle stands as resistance at 9,080 levels. Symmetrical triangle possible chart pattern price target stands at 9,500 levels. Swiss benchmark equity index performed better than its European peers. This week's report features three different bullish chart developments on the Swiss financial stocks. Swiss Market Index ETF is available in local (CHF) currency via iShares SMI ETF that is listed on the Swiss Exchange. Also, a USD denominated ETF is listed on the New York Stock Exchange via iShares MSCI Switzerland Capped ETF (EWL).

Read More

GLOBAL EQUITY MARKETS – July 22, 2017

REVIEW


U.S. Biotech stocks resume uptrend after their strong breakout in the last week of June. June 17, 2017 and June 24, 2017 Global Equity Markets reports drew attention to the strength in the Biotech ETFs and alerted members on the multi-month bullish chart pattern completions. Both SPDR S&P BIOTECH ETF and ISHARES NASDAQ BIOTECH ETF had strong breakouts. After few weeks of pull back to the previously broken chart pattern boundary, NASDAQ BIOTECH INDEX resumed its uptrend. Read More

GLOBAL EQUITY MARKETS – July 15, 2017

REVIEW


Global equities had a strong performance led by Emerging Market equities and mainly Chinese Large-caps. MSCI Emerging Markets Index breached its decade-long trend line resistance at 1,020 levels. Tech Charts Global Equity Markets reports drew attention to the developing strength in Emerging Asia equities. Following the strong performance of S.Korea, Taiwan, India and Philippines, Chinese equities are also joining the list. An interim update was sent out during the week discussing the strong breakout on the Ishares China Large Cap ETF (FXI). Below charts feature the MSCI Emerging Markets Index (Price index in USD) and the New York Stock Exchange listed iShares MSCI Emerging Markets ETF (EEM).

Read More

INTERIM UPDATE – July 13, 2017

ISHARES CHINA LARGE CAP ETF (FXI)

A major chart pattern development is taking place on the Chinese equity ETF that is listed on the New York Stock Exchange. Ishares China Large Cap ETF is possibly completing a major 20 month-long base formation. Multi-month H&S bottom chart pattern has a neckline at 39.65 levels. Breakout attempt in the first quarter of 2017, was followed by a short-term set-back that found support at the neckline. However, during this week we can see that the China Large Cap ETF gained momentum once again. Read More

GLOBAL EQUITY MARKETS – July 8, 2017

REVIEW


It has been more than six months that the U.S. small caps are trading in a tight range. One of the well-defined chart patterns the weekly global equity markets report frequently discussed was the ISHARES CORE S&P Small-Cap ETF. IJR has a well-defined trading range between 66.9 and 70.8 levels. The ETFs price is holding above the 18 month-long upward trend line. A directional move should follow soon. The margin between the multi-month trend line and the upper boundary of the 6 month-long rectangle has narrowed. A daily close above 71.80 will confirm the breakout from the 5 month-long rectangle and suggest higher prices. A breach below the 18 month-long trend line can put pressure on the small caps and push prices towards the lower boundary of the rectangle at 66.9 levels.

Read More

GLOBAL EQUITY MARKETS – July 1, 2017

REVIEW


Europe's equity benchmarks tested critical long-term resistances. After reversing from the multi-year trend line, Euro Stoxx 50 index pulled back to the lower boundary of its year-long trend channel. If the 2 month-long correction has run its course (still no sign of reversal), Europe's equity benchmark can possibly rebound from the lower boundary of its trend channel. During May 2017 the index tested 3,670 levels and since then retreated towards the lower boundary of its year-long trend channel. Failure to hold at the lower boundary of the trend channel can extend the duration of the corrective period.

Read More