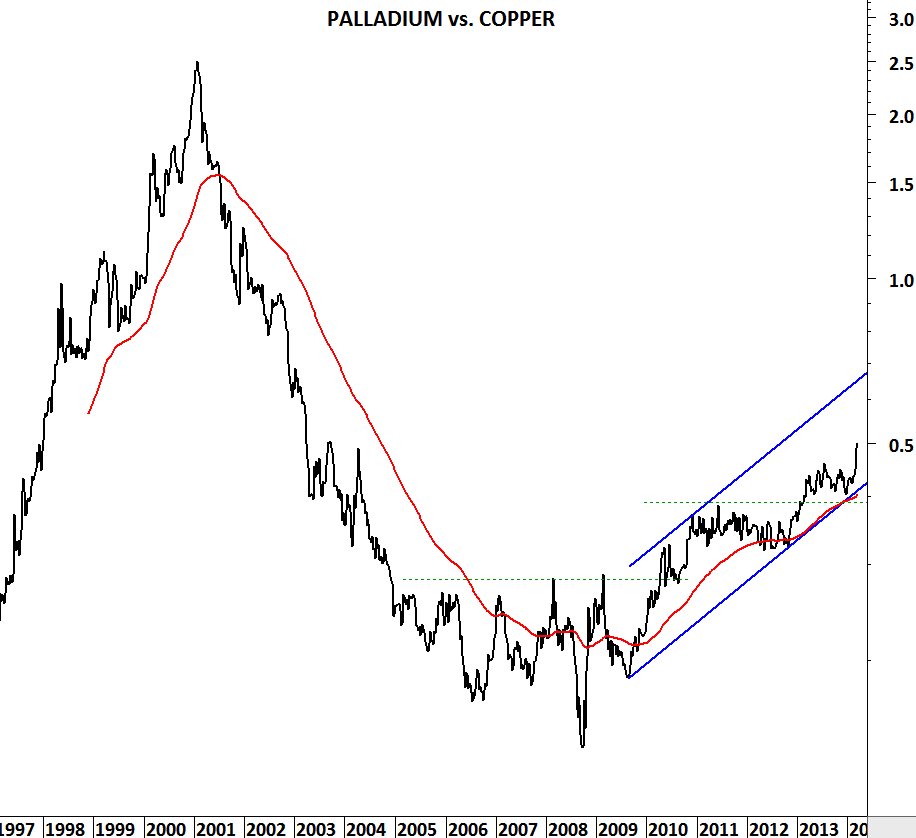
PALLADIUM and COPPER

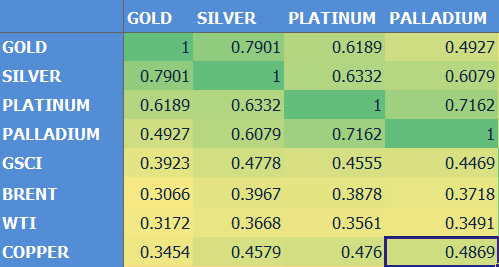
Both Palladium and Copper have industrial use. Yet one has clearly outperformed the other over the past four years. Charts suggest the latest strength in Palladium and weakness in Copper could continue. 10 year weekly correlation between Palladium and Copper has been positive 0.4869.

CORRELATION

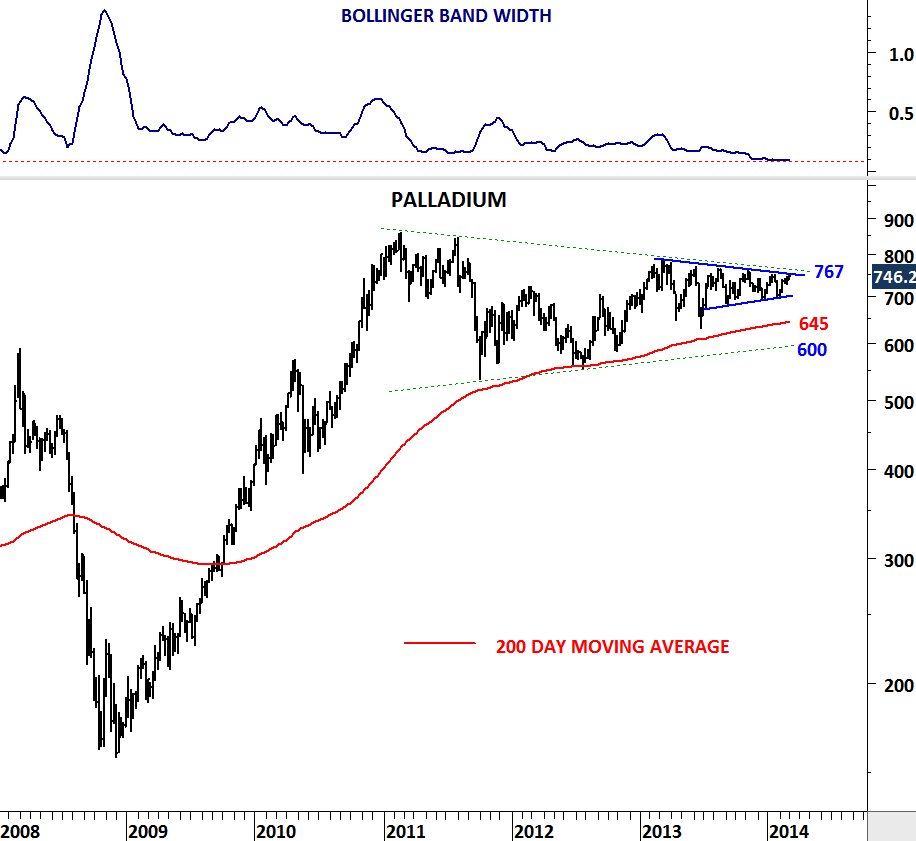
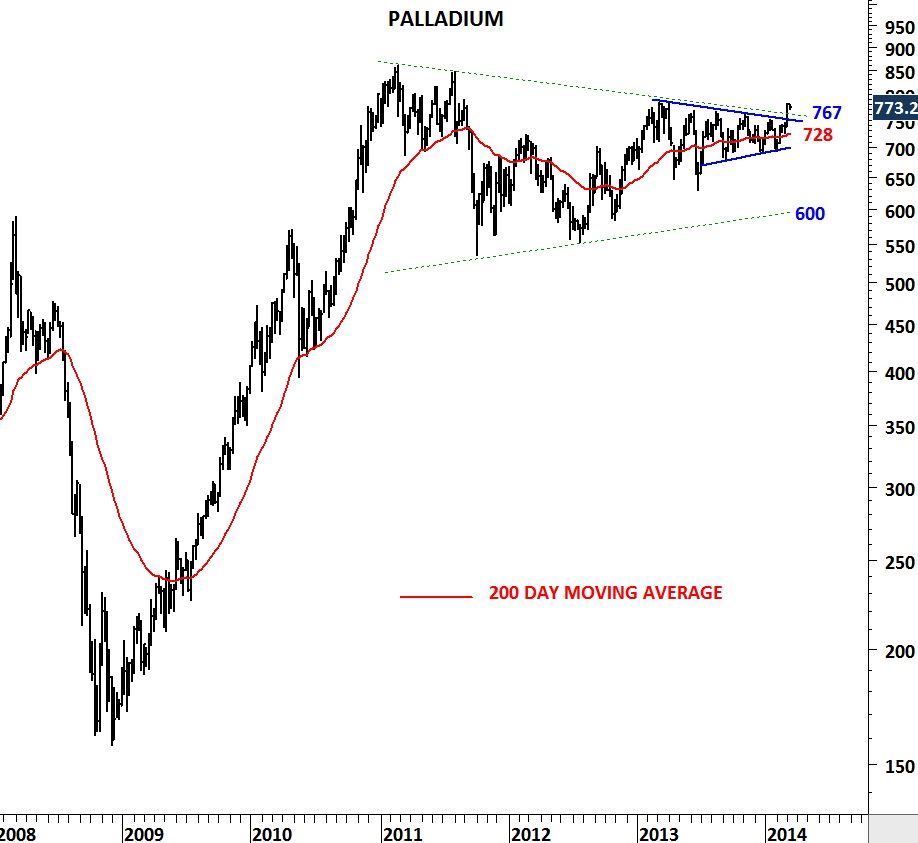
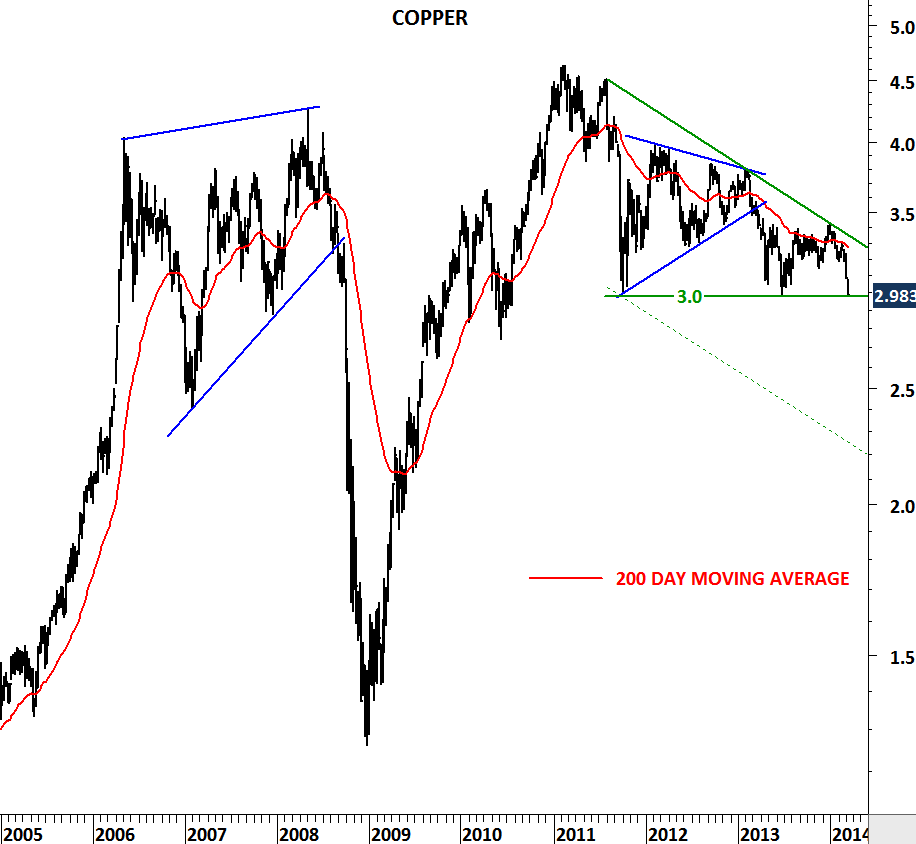
Last week Palladium broke out of its year-long sideways consolidation pattern. While Copper has been in a downtrend and clearly below its long-term average. Weakness in Copper price is continuing this week with the industrial metal now challenging the strong support at 3 levels. Breakdown below 3 levels will have long-term negative implications.

PALLADIUM III

COPPER

Relative performance ratio between Palladium and Copper favor Palladium in the medium-term. An interesting fact is that Palladium has been outperforming Copper since the beginning of 2009. This trend should continue.

PALLADIUM VS COPPER

BRENT CRUDE and PALLADIUM

Strong breakouts are likely on these two commodities in the following weeks. Both Brent Crude oil and Palladium reached multi-year low volatility levels. Volatility is cyclical. Low volatility periods are usually followed by high volatility and vice versa. Charts below show Brent Crude Oil ETF trading in London and Palladium cash price. Breakout above 73 levels on ETFS Brent and also above 767 levels on Palladium will be followed by strong trend periods. We should monitor these two commodities closely in the following weeks.

ETFS BRENT

PALLADIUM

Gold, Silver, USD and Unemployment

Here are some of the charts that I shared on twitter today. U.S. weekly jobless claims chart is extremely important as I shared several updates on this topic. Year 2013 can prove to be a major low for weekly jobless claims figure.

Both Gold and Silver are now close to major support levels.

U.S. dollar index rebounded from a 2 year-long trend support.

and some other updates on EUR/TRY, USD/TRY and NIKKEI…

Yields, Copper and Nikkei

Some quick thoughts I just shared on twitter. Charts are valuable. Notes on these:

1) 10 Year U.S. yields are climbing higher. Now very close to strong 7 year-long trend resistance. Breakout above 3.0 levels could be a “game changer”.

2) Nikkei 225 has strong long-term resistance at 16,000 levels. As it approaches to that level, expect weakness.

3) Copper might be forming a medium-term base at these levels. Breakout above 3.35-3.50 will be bullish in the medium-term with a price target of 4.

COCOA & SOY MEAL

COCOA

I analyzed Cocoa prices in October and drew attention to the strong horizontal resistance at 2,800 levels. That study needs an update now as the price is challenging the strong resistance for a possible breakout. Higher prices could be seen in the following weeks once this base formation completes with a similar breakout that took place in the beginning of 2007.

SOY MEAL

Soy Meal is another commodity that could move higher in the following weeks as the price finds support between 380 and 390 for the 5th time over the past two years. Last one year’s trading range has been between 380 and 550. A buy signal on weekly MACD, similar to earlier reversals, will confirm the bullish outlook for the short/medium-term. Price could target 550 levels once again.

COPPER

Copper prices might be forming a medium-term base at these levels. Confirmation of the base formation will be a decisive breakout above 3.4 levels. Chart pattern suggests an inverted head and shoulder might be close to completion once price clears 3.4 levels. MACD is trying to reverse from 0 levels (bullish) and price is challenging the 200 day moving average. On the weekly scale 3.0 levels acted as strong support after price tested it for three times over the past two years. Until we see a decisive breakout above 3.4 levels technical outlook should remain neutral. Above 3.4 levels price will target 3.7 levels and the technical outlook will turn to positive.

Weekly price chart of COPPER

COPPER weekly

Daily price chart of COPPER

COPPER daily

COCOA

COCOA

COCOA daily

Cocoa moved higher after its breakout from the base formation – a cup with handle. This chart pattern is usually regarded as bullish and a breakout above the horizontal resistance suggest higher prices. Price target is calculated by adding the width of the formation to the breakout level. In the beginning of August (August 8, 2013), I’ve analyzed Cocoa prices and drew attention to the breakout and calculated a price target of 2,800. Since then prices have climbed higher and reached the formation price target.

Cocoa can slow down at these levels but a breakout above this flat resistance could send prices higher resulting in a similar uptrend that took place between 2007 and 2008.


COCOA (SEP3)

COCOA I COCOA II

Cocoa prices might be forming a short/medium-term base at the long-term trend channel support. Cocoa had sharp and wide swings over the past decade. The uptrend remained intact as it can be seen from the upward sloping trend channel. In the beginning of 2011, price reversed from the upper boundary of the trend channel at 4,000 levels and reached the lower boundary at 2,000. Since then the soft commodity has been consolidating above the long-term trend channel support. With this week’s breakout above 2,400 levels Cocoa might be forming a cup & handle chart pattern, usually regarded as a bullish chart formation that could target 2,800 levels. In the short-term technical outlook on Cocoa turns positive. As long as price remains above 2,400 levels, the soft commodity will have an upward bias.

LUMBER

LUMBER

In December 2012 we have seen Lumber price clearing the strong horizontal resistance at 330 levels. Breakout was followed by a sharp rise towards 400 levels in less than two months. Since March 2013, Lumber has been pulling back to the previously broken support/resistance area. Price should find support between 330 and 340 levels and rebound once again. The lower boundary of the last one year’s uptrend, 200 day moving average and horizontal trend line are all forming support between 330 and 340 levels.

OATS

OATS

Long-term symmetrical triangles are powerful chart patterns to trade. They have defined boundaries and breakouts from these type of consolidation patterns are usually followed by strong trend periods. Consolidation ranges are considered to be low volatility periods where price fluctuates around the moving averages. Low volatility periods are followed by high volatility periods and vice versa. As a result long-term consolidation patterns unfold into a large-scale up/down trend periods.

SOY MEAL

In March 2012 we have identified a 4 year-long symmetrical triangle on Soy Meal. Breakout from this chart pattern resulted in a multi-month uptrend. Similar technical set-up is present on Oats price chart after 4 year-long sideways consolidation. Breakout above 400 levels could result in a strong uptrend. Soy Meal reached its price target at 550 levels. After a confirmed breakout I will update this chart with the possible price targets. For now we should put Oats on our watch list for a possible strong breakout.