
OATS
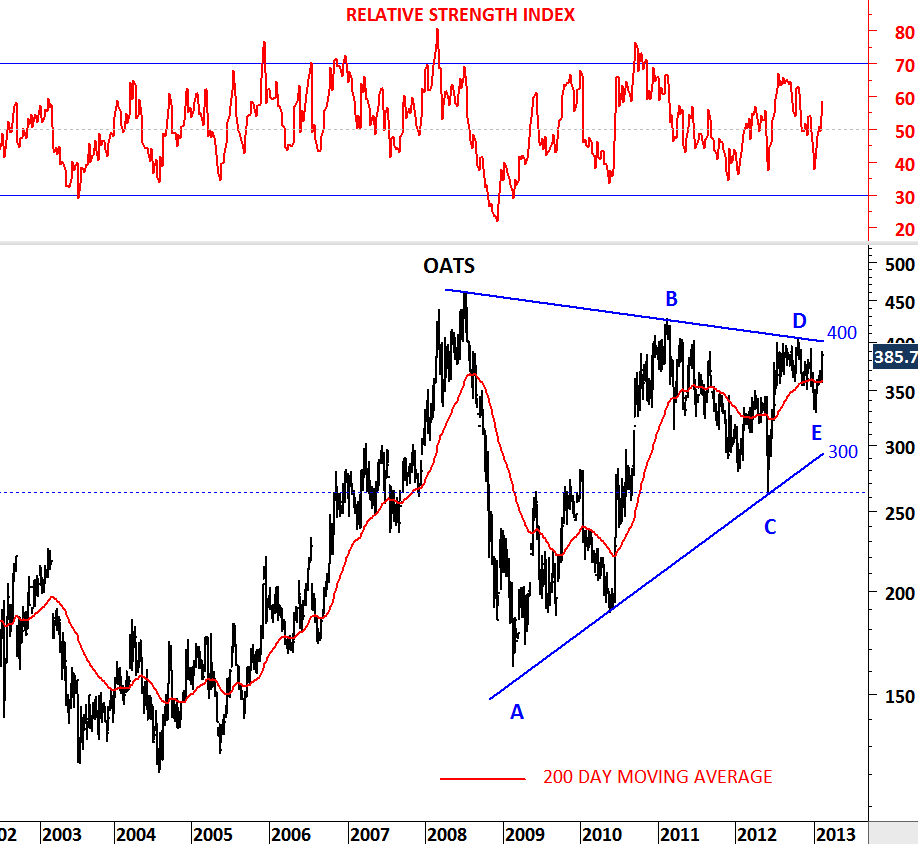
Long-term symmetrical triangles are powerful chart patterns to trade. They have defined boundaries and breakouts from these type of consolidation patterns are usually followed by strong trend periods. Consolidation ranges are considered to be low volatility periods where price fluctuates around the moving averages. Low volatility periods are followed by high volatility periods and vice versa. As a result long-term consolidation patterns unfold into a large-scale up/down trend periods.
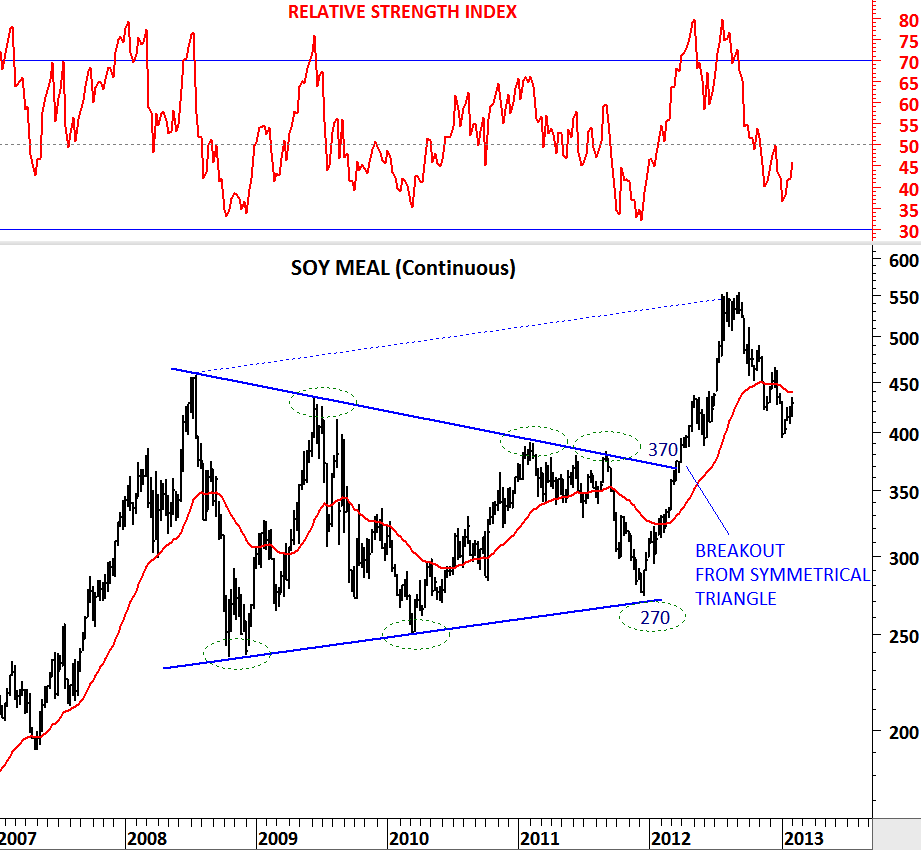
In March 2012 we have identified a 4 year-long symmetrical triangle on Soy Meal. Breakout from this chart pattern resulted in a multi-month uptrend. Similar technical set-up is present on Oats price chart after 4 year-long sideways consolidation. Breakout above 400 levels could result in a strong uptrend. Soy Meal reached its price target at 550 levels. After a confirmed breakout I will update this chart with the possible price targets. For now we should put Oats on our watch list for a possible strong breakout.

