ZINC

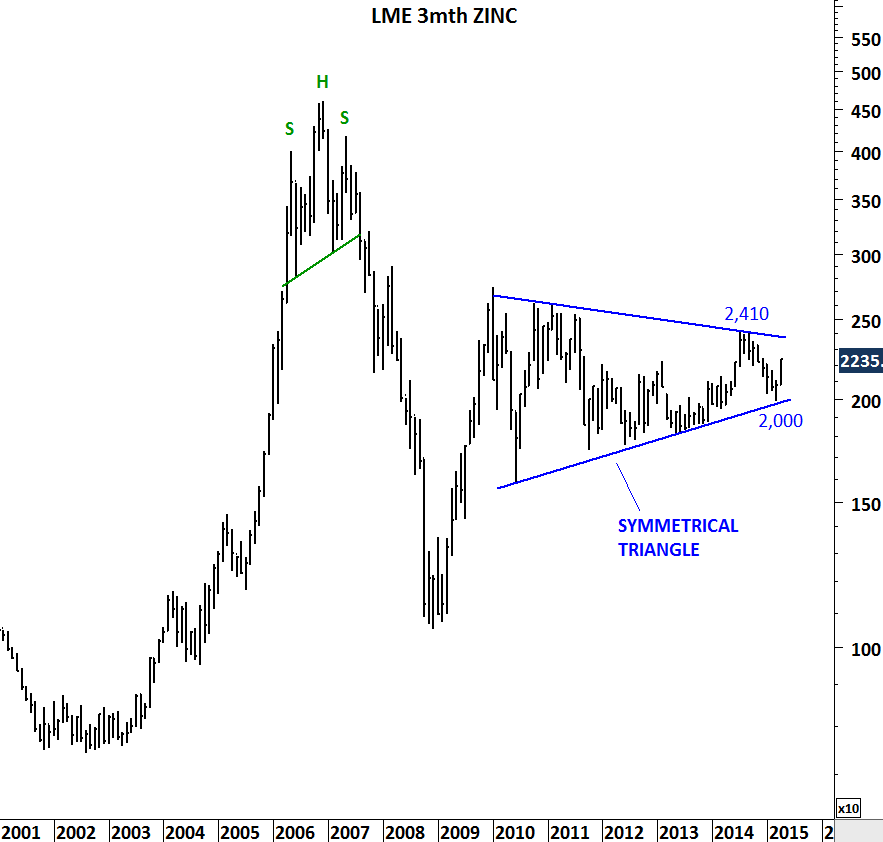
Symmetrical triangle is a reliable chart pattern. It usually forms as continuation pattern but after long down/up trend it can also reverse the prolonged trend. Converging trend lines indicate the balance of power between the buyers and sellers. Best way to trade symmetrical triangles is to wait for a decisive breakout from the tight consolidation range.

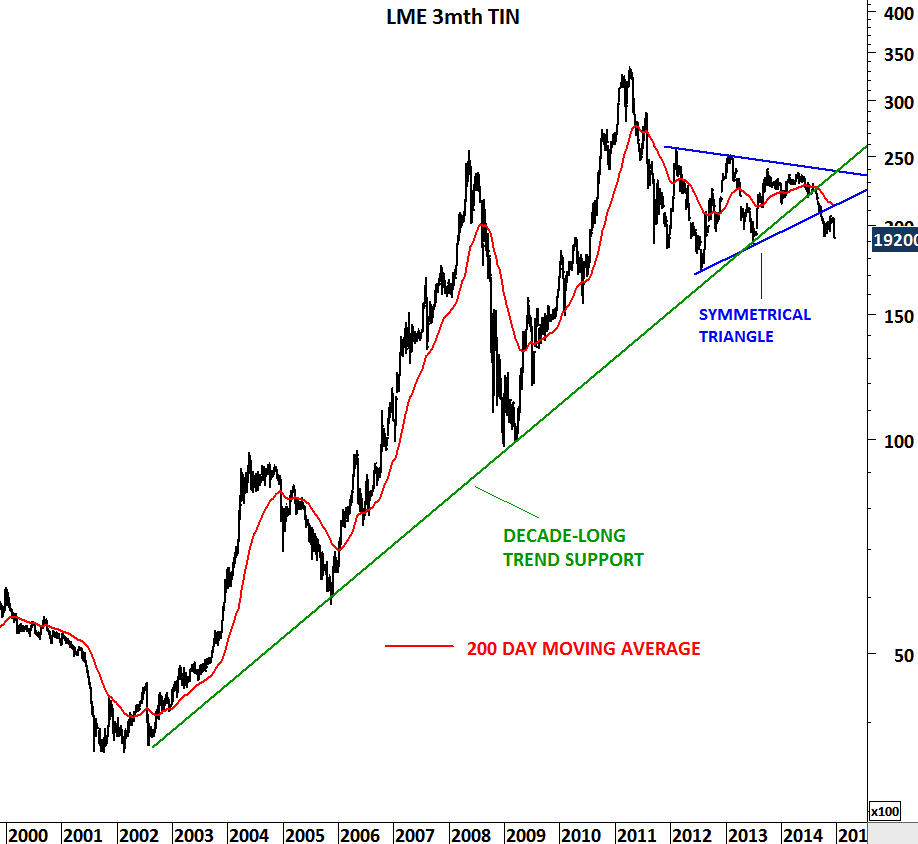
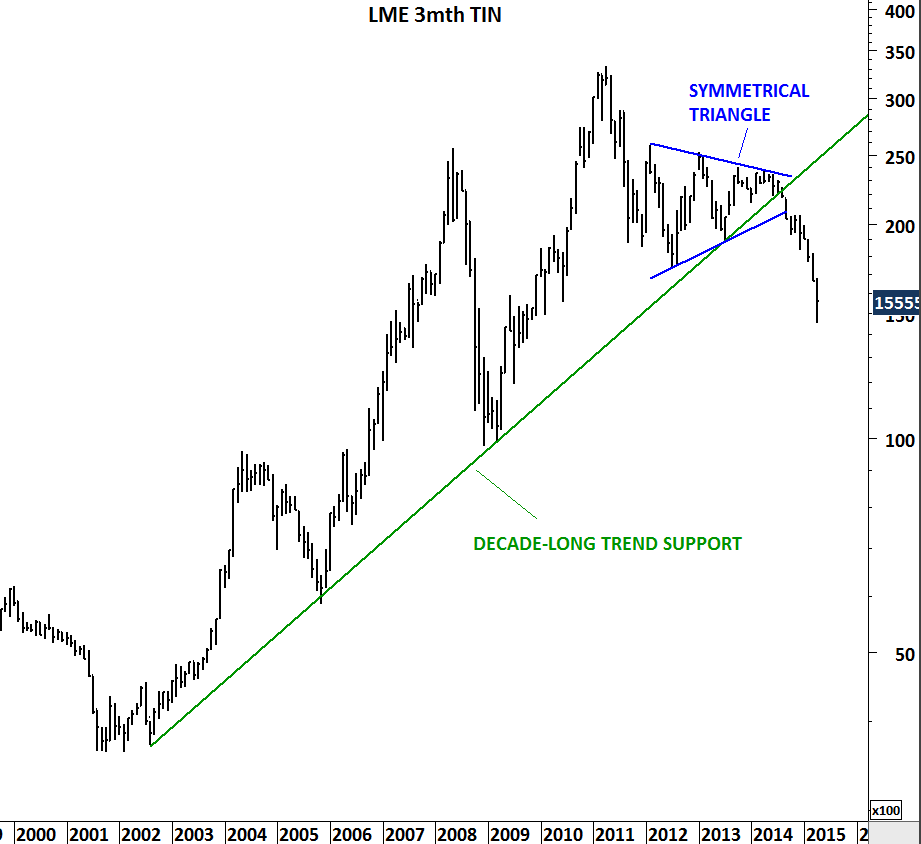
Industrial metals have been weak over the past five years. In December 2014 (earlier analysis), TIN prices formed a perfect symmetrical triangle and broke down major support resulting in a strong downtrend.

TIN

Since the beginning of 2010, ZINC price has been consolidating in a sideways trading range. Another perfect symmetrical triangle might be in progress. Breakout above 2,410 or below 2,000 levels can result in a strong trend period. ZINC chart provides long-term opportunity.

ZINC

PLATINUM

PLATINUM

Commodities markets have performed poorly compared with stocks over the past 3 years. From industrial metals to agricultural commodities deflationary pressures are being felt worldwide.

Platinum prices which is almost 50% lower than 2008 historical high levels, is now testing a 15 year-long trend support. Usually prices should rebound sharply from such historical level. However, over the past four months the performance has been lackluster. Breakdown below 1,170 levels will have long-term implications and will be negative for Platinum prices. It is important to note that the next major long-term support is around 735 levels. Next few months will be extremely important for the medium/long-term trend.

FEEDER CATTLE

FEEDER CATTLE had a strong bull market since its long-term breakout in 2010. Though, this uptrend might be over. Feeder Cattle which had a strong rally after breaking out of its 2005-2010 consolidation period, formed a head & shoulder top chart pattern. Both the neckline and the 200-day moving average were between 208-215 area. Price broke down the neckline and the 200-day moving average. Possible H&S price target remains at 180 levels. Unless we see Feeder Cattle price climbing back above 208-215 area in the following days/weeks, expectation will be lower prices towards 180 levels.

Note: Analyzed chart is the March 2015 Feeder Cattle futures contract that trades on the CME. For more information you can follow this –> More info on FEEDER CATTLE

FEEDER CATTLE I

FEEDER CATTLE II

COPPER vs. GOLD

Over the past two decades Copper underperformed Gold during turbulent times in the financial markets. Ratio between Copper and Gold declined sharply during 2000-2003 and 2007-2009 periods. Latest breakdown from the consolidation range can result in further underperformance for Copper. This is a powerful long-term chart with a strong message.

COPPER vs GOLD

TIN

TIN IMAGEOne of the strongest bull markets in the metal complex is about to end. Tin is highly used in electronics. It is mixed into solder for circuitry in smartphones. Tin is used in everyday life in almost all electronic item. Notebooks, tablets, smartphones… Chart pattern suggests prices are headed for lower levels as we have seen some major breakdowns over the past year. Both the uptrend that has been intact since 2002 and the medium-term sideways consolidation (symmetrical triangle) have broken down. Unless we see a recovery above 21K levels, price could sell-off towards 15K-12K area in the following months. I have also added other industrial metals such as Lead, Aluminum and Copper. Both Copper and Tin are likely to join the weakness in other industrial metals.

TIN

ALUMINUM

COPPER

LEAD

PALLADIUM

PALLADIUM

Negative divergence on Palladium chart is a red flag. Divergences are first warning signals of a possible trend reversal. However they should be confirmed by price action – a decisive breakdown. There are few negative signs on this long-term (monthly scale) chart.

1) Price breached its previous high but failed to hold above that level (865).

2) Top in 2011 and the new high in 2014 are not confirmed by the momentum indicator (RSI (14)).

3) Uptrend that started from the low in 2012 has been very weak and choppy.

In the coming months, a breakdown below 700 levels can send Palladium towards 500.

I welcome any thoughts on the possible supply/demand that resulted in such price action or could impact the price in the coming months.

COPPER

Once again copper is at that critical support. The more price tests an important support level the higher the probability of it breaking down. This is the case on copper price chart. 3 levels have been tested several times over the past 3 years. Commodities have been weak but copper held well above major support. Decisive close below 2.90-2.95 area will confirm breakdown from the descending triangle. Outlook for copper is negative.

COPPER

COPPER

Industrial metals continue to remain weak. Charts warn of a slowdown in global growth. Copper, usually regarded as Dr. Copper due to its leading indicator role for economic growth, is warning us of a possible breakdown and a correction.

Chart patterns are result of human interaction. Forces of greed and fear meet in the market place and form identifiable patterns on price charts. Descending triangle is one of the common bearish chart pattern. Horizontal support line shows the level where buyers step in. Downward sloping trend line shows the supply (resistance).

COPPER

Copper price formed a descending triangle over the past 3 years. Strong support remains at 3 levels. Breakdown below 3 levels can result in a sharp decline towards 2-2.5 range. Latest consolidation should resolve in one direction in the following weeks/month.

COPPER 2014

Copper had a similar descending triangle during 1989-1993 period. 4 year-year long chart pattern resolved on the downside with the breakdown of 0.95 support level in 1993. In less than six months prices have dropped to 0.72 levels.

COPPER 1990

LUMBER

Lumber prices prepare for a strong breakout from a 2 year-long consolidation. Since the beginning of 2013, prices have been consolidating in a contracting range with the boundaries now standing at 360 and 300 levels. Latest rally towards the upper boundary suggests prices are likely to challenge the strong resistance in the following days/week. A decisive breakout above 360 levels will be positive and will target 400 levels in the short/medium-term.

LUMBER II

GOLD

Year-long consolidation in Gold prices  should end soon. A strong trend period should follow once the symmetrical triangle is resolved in one direction. Volatility has decreased on weekly scale and this increased the likelihood of high volatility period in the following weeks/months. Boundaries of the consolidation stand at 1,270 and 1,360 levels. Breakout above 1,360-1,400 area will push gold price higher towards 1,525 levels. Breakdown below 1,250-1,270 support area will result in another downtrend towards 1,150 levels.

GOLD