FEEDER CATTLE
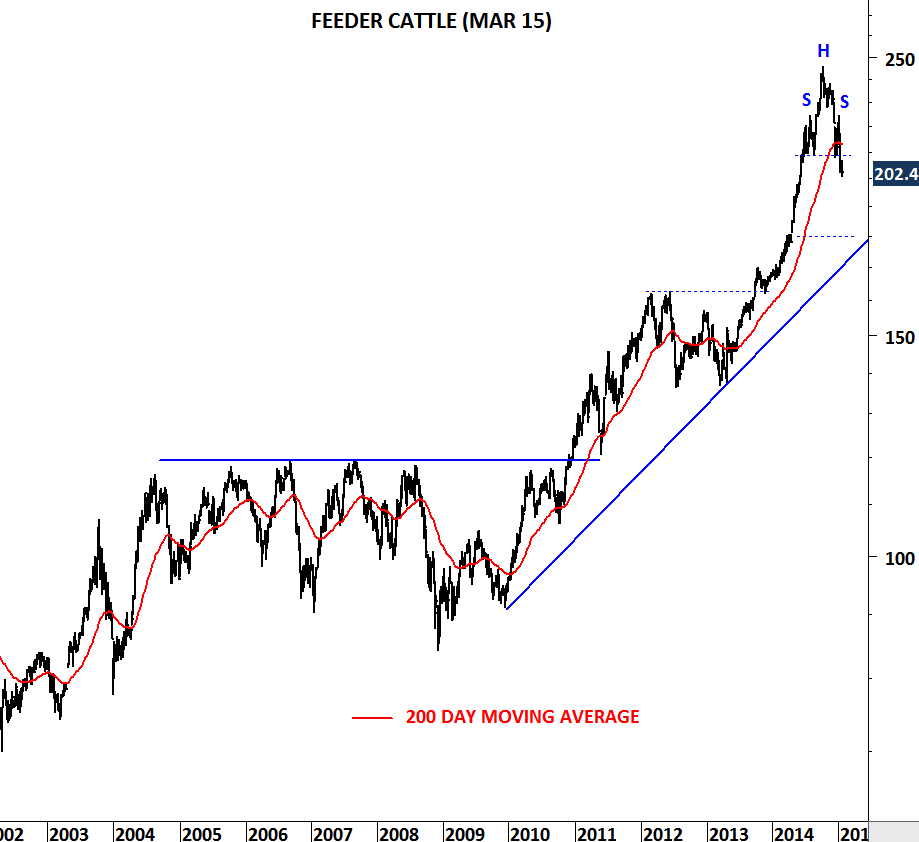
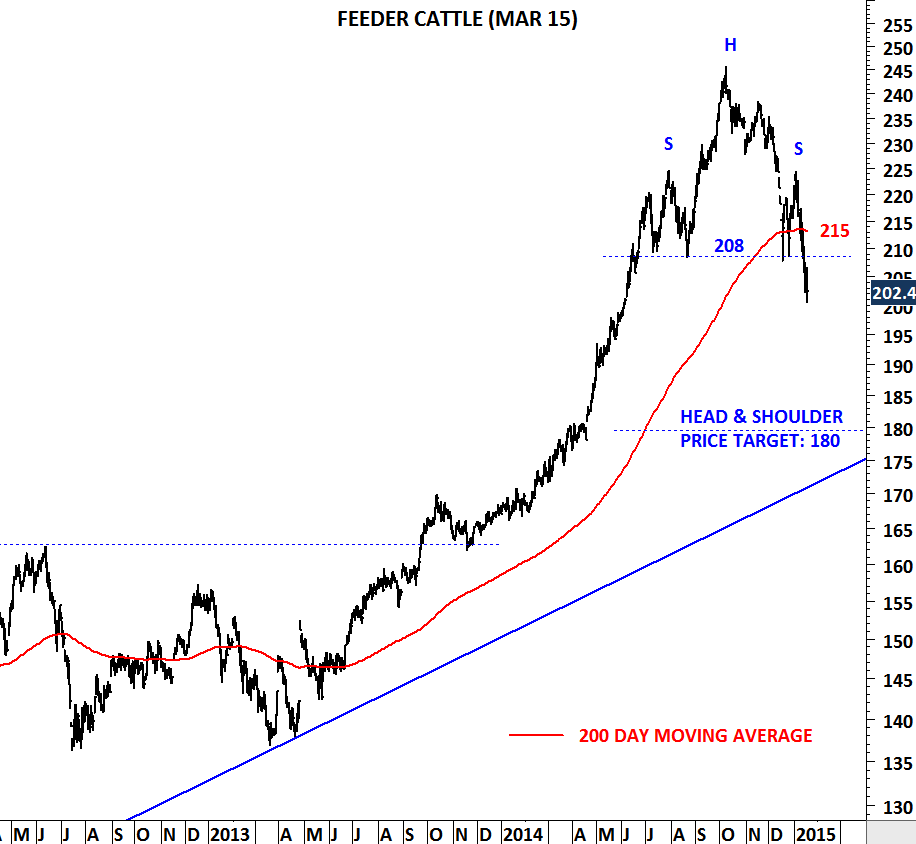
FEEDER CATTLE had a strong bull market since its long-term breakout in 2010. Though, this uptrend might be over. Feeder Cattle which had a strong rally after breaking out of its 2005-2010 consolidation period, formed a head & shoulder top chart pattern. Both the neckline and the 200-day moving average were between 208-215 area. Price broke down the neckline and the 200-day moving average. Possible H&S price target remains at 180 levels. Unless we see Feeder Cattle price climbing back above 208-215 area in the following days/weeks, expectation will be lower prices towards 180 levels.
Note: Analyzed chart is the March 2015 Feeder Cattle futures contract that trades on the CME. For more information you can follow this –> More info on FEEDER CATTLE