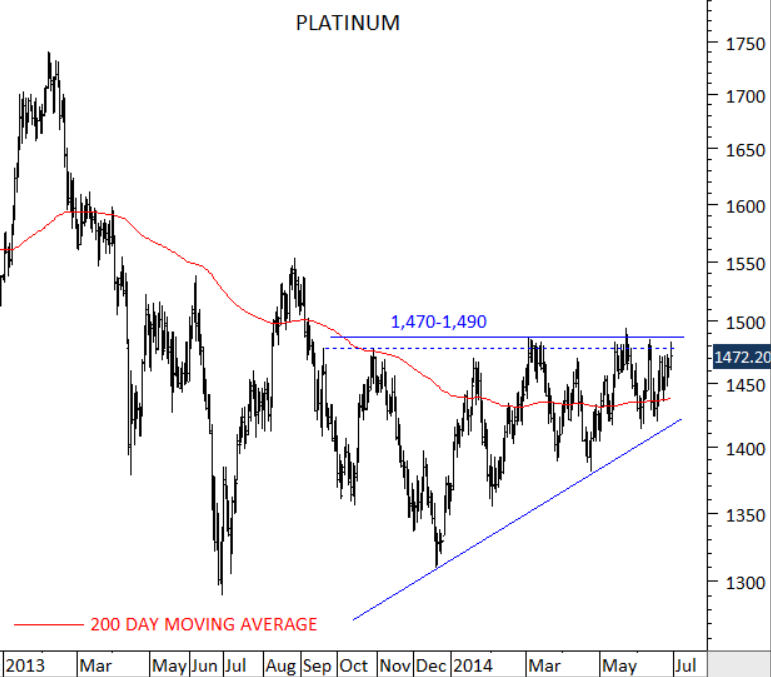
PLATINUM

After a long consolidation period, Platinum might be preparing for a strong breakout. Since the beginning of 2014, Platinum price has been forming higher highs and a horizontal resistance. Strong horizontal resistance area remain between 1,470 and 1,490. Breakout above the resistance area can push prices higher towards 1,550-1,600 range.

PLATINUM

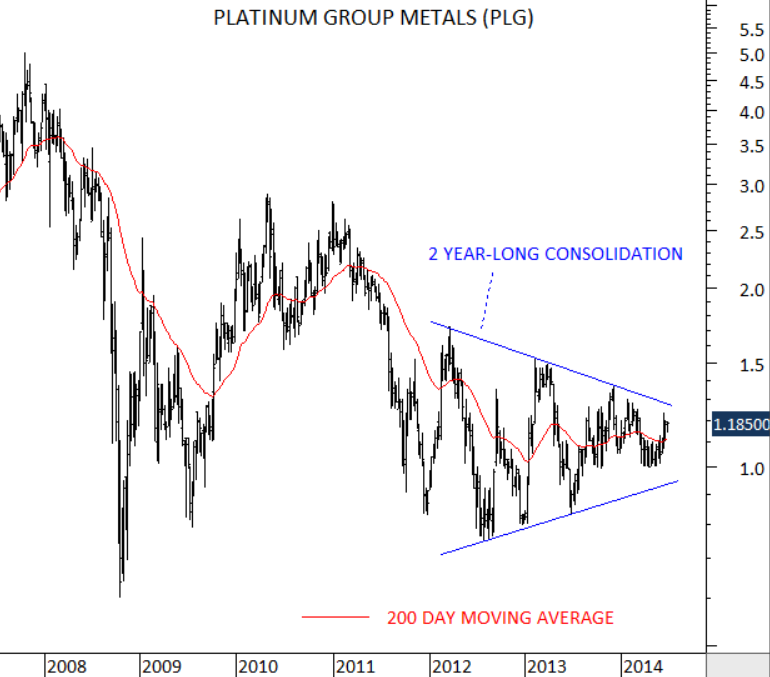
Another interesting chart development can be seen on Platinum Group Metals – an equity listed in NYSE. Stock has formed a perfect symmetrical triangle. Strength in Platinum can result in a breakout on this long-term chart pattern. In the following weeks I will keep an eye on precious metals and especially on Platinum.

PLATINUM GROUP METALS

BRENT CRUDE OIL

While you are reading this post please note that I’m not basing my decision-making and my analysis on the latest developments in middle east. I’ve been analyzing Brent crude and the energy sector for some time. Earlier analysis (May 17, 2014 / Mar 29, 2014 / Mar 3, 2014) suggested a strong directional move that is likely to develop. Low volatility periods are usually followed by high volatility and vice versa. Brent Crude oil and energy sector has been consolidating for more than 2 years in a very tight range. This resulted in a historical low volatility. In other words “calm before the storm”. Breakouts from these type of low volatility trading ranges are usually very powerful. This was the basic assumption that I based my analysis on. Latest developments in the middle east can be a trigger for higher prices (still to be seen). Rather than focusing on the short-term news effect I would like to draw your attention to the larger scale breakout that can take place in the energy sector. As I have mentioned in my earlier updates, energy sector is likely to be the hot topic in the second half of the year.


BNO

ETFS BRENT

BRENT CRUDE OIL

CORN

Is Corn forming a perfect inverted head and shoulder chart pattern? If yes, price should rally from these levels and reach the neckline around 530 levels in the next few weeks and if you see such price action you should be more confident that a year-long base formation is about to complete, suggesting much higher levels. I like to see symmetry in head and shoulder chart patterns and also a horizontal neckline. So far the chart pattern followed these characteristics. We are probably still at the early stages but it’s worth adding this chart to our watch list as a bullish chart development.

CORN

BRENT CRUDE OIL

Over the past few months I wrote several updates on Brent Crude Oil . I think energy sector will be the “hot” topic in the second half of the year. The likelihood of a strong breakout is increasing as the consolidation resumes in this tight trading range. Breakouts from low volatility periods are usually very powerful.  United States Brent Oil ETF (BNO) trades in NYSE (New York Stock Exchange) and ETFS Brent (OILB.L) trades in LSE (London Stock Exchange). Both charts are due for a strong breakout. Breakout above 45 levels on (BNO) and above 73 levels on (OILB.L) will be very bullish for the energy sector. Another chart that is likely to follow the same trend in the energy sector is BP (BP.L). BP trades in LSE. Breakout above the strong horizontal resistance at 510 levels will be bullish for the stock.  These are the charts and levels that I’m watching closely to understand what is next for the energy sector.

What is your view on this? Are there any other supporting factors/developments that suggests a strong directional move any time soon? You can share your views with other followers.

BNO

ETFS BRENT

BP

COTTON

Long-term charts are usually very powerful and reveal important information. Over the past four decades  cotton price fluctuated between 95 and 30 levels with the exception of two occurrences in 1995 and 2010. Breakouts from long-term consolidation ranges are usually followed by strong trend periods. Breakout above 95 will push Cotton price outside of its long-term consolidation range. Such breakout could trigger another sharp rally on the upside. Earlier short/medium-term analysis on cotton is here.

COTTON

SILVER and COPPER

Both metals avoided sharp sell-offs by holding above critical support levels. Silver tested the strong support area between 18.3 and 18.8 for the 3rd time over the past year. Copper managed to hold above 3 levels which acted as strong support since 2012. Copper and Silver can rebound towards their long-term averages. 200-day average for Silver remains at 21.25 and for Copper at 3.2. Before we see decisive break downs of the strong support areas (Silver: 18.3-18.80, Copper: 2.85-3.0), we should expect neutral/positive technical action on Silver and Copper.

SILVER

COPPER II

INDUSTRIAL METALS

Industrial metals remain to be an emerging market story. 3 year and 5 year weekly rolling correlations show high correlation between the MSCI Emerging market index and most of the industrial commodities. As expected there is also high correlation between the industrial metals. Zinc, Copper and Lead are high correlated industrial metals.

3 YEAR WEEKLY ROLLING CORRELATION

INDUSTRIAL METALS 3 YR CORR

5 YEAR WEEKLY ROLLING CORRELATION

INDUSTRIAL METALS 5 YR CORR

Since mid-2011, most of the industrial metals had lackluster performance. Sideways/downwards price movements were similar to the MSCI Emerging Market index. Charts are suggesting that we are getting closer to the end of the medium/long-term consolidation periods. Lead, Zinc and Tin are completing their contracting ranges and breakouts should occur in the following months. Over the past few weeks Nickel had a strong run but it is still below its downward trend resistance. Both Aluminum and Nickel performed worse than Lead, Zinc and Tin. Breakouts on these industrial metals could result in a 3-4 year-long directional movements. Global growth and emerging market performances will depend on the direction of the breakouts in these industrial metals.

ALUMINUM

COPPER

LEAD NICKEL

TIN

ZINC

MSCI EM

BRENT CRUDE OIL

Oil prepares for a massive breakout in the following weeks/months. Magnitude of the price change is likely to make the oil “the hot topic” in the financial media. Why am I saying this?

1) Breakouts from low volatility periods are usually very powerful and are followed by strong directional moves. United States Brent Oil ETF (BNO) and ETFS Oil Securities (OILB.L) both meet this criteria.

2) The longer price tests a trend resistance the more valid that level becomes. 45 levels on the BNO and 73 levels on the ETFS Brent are strong horizontal resistances. They are valid trend lines.

While it is still early to call for a direction, I would suggest everyone should place these two charts at the top of their watch list. A strong directional move is overdue.

BNO

ETFS BRENT II

COTTON

COTTON

Cotton price prepares for a strong breakout from its 2 year-long base formation. Recent consolidation can be one of the two bullish chart formations. A cup with handle chart pattern or an ascending triangle.

CHART PATTERNS

If it is the former, Cotton should break above 94 levels in the short-term. Breakout above 94 levels will clear 2 year-long horizontal resistance and should be very bullish for Cotton prices.

If prices are forming an ascending triangle, breakout above 94 will be delayed. Only after another pullback towards the 200-day moving average will Cotton challenge the 94 resistance. One or the other, current technical outlook is bullish and suggests higher prices in the medium-term. Watch 94 levels as strong resistance.

GOLD

Above are some of the updates I shared with TechCharts followers on GOLD. Since the beginning of 2013, it is the first time GOLD has breached its long-term moving average. Strong momentum should push prices towards 1,440 levels in the following weeks. 200-day moving average at 1,330 levels will become the “new” support.

GOLD