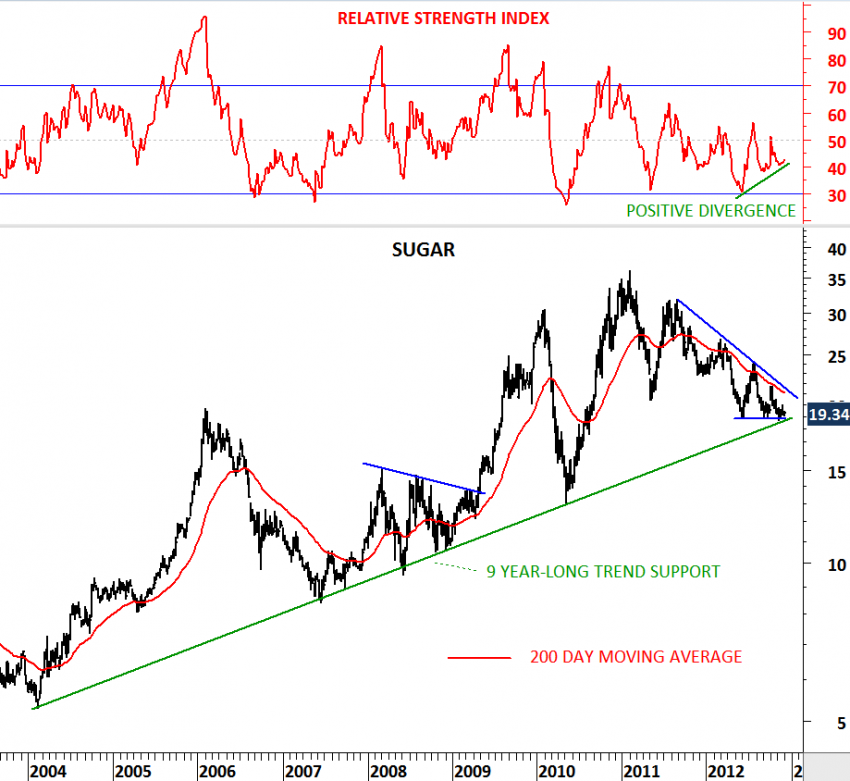
SUGAR

After reversing from 35 levels in the beginning of 2011, Sugar price spent the past two years in a correction by pulling back to its long-term trend line. 9 year-long trend support met the price at 19 levels. As price reached the long-term support, downward momentum weakened and relative strength index generated positive divergences on the weekly scale chart. From a long-term perspective sugar prices might be close to forming a major bottom. While it is still early to call for a reversal and a rebound from the long-term support, we should keep a close eye on this commodity for a strong technical action in the following weeks. Breakdown below 19 levels will be negative in the medium/long-term. For the long-term uptrend to resume, sugar price needs to put a bottom at these levels.

SUGAR

WHEAT

After a dry summer and a global scale drought, agricultural commodity prices moved higher resulting in returns in excess of 30%. From those, wheat and corn were sharply higher when compared with other soft commodities like coffee, cocoa, cotton & sugar. Sharp spike in wheat prices pushed the agricultural commodity from 600 to 950 levels in less than two months. Wheat price reached 947 levels by the end of July. Since the beginning of August it has been relatively quiet for agriculturals. Over the past three months wheat price has been consolidating above 840 levels; a medium-term support level. Short/medium-term consolidation took a bullish flag or pennant shape that is now closer for a decisive breakout. While bullish flags and pennants are usually continuation patterns in an ongoing trend, a safe way to trade these set-ups is to wait for a breakout as a confirmation. I’ve defined the boundaries of the short/medium-term consolidation. 910 levels act as resistance and 842 levels as support. Breakout in either direction should result in a strong trend and present a good medium-term opportunity. Breakout above 910 levels could target 1,000-1,100 area and breakdown below 842 levels could pull price towards 777 levels.

GOLD, SILVER and PALLADIUM

Metals have been one of the exciting areas as we got closer to the end of this week. Precious metals moved higher and challenged important resistances. First, we saw a major breakout on Platinum followed by Palladium. Low volatility range breakouts are usually very powerful and are followed by strong moves. While a surge in volatility can last for several weeks it can also fade in a few days. False breakouts (head fakes) are part of the game. However, when combined with technical chart pattern breakouts (flags, wedges, pennants, triangles etc.), low volatility breakouts usually present good trading opportunities.

Palladium was one of the precious metals that clearly broke out of its short-term consolidation range on Friday. The strong move was followed by Platinum’s breakout which took place on Thursday. Both Gold and Silver closed the week at critical resistance areas and we are likely to see a directional movement on these metals sooner or later. I’ve attached metals charts with their critical support/resistance levels to watch. Gold has to clear 1,630 level and Silver has to break above 2,850 level. Failure to do so will result in more sideways consolidation.

WHEAT

While global equity markets and commodities are experiencing sharp corrections, an underperforming commodity in the grains complex, wheat started breaking out of its range. Latest technical action is similar to the earlier breakout that wheat experienced in the summer of 2010. In July-August period it took 4 weeks for wheat prices to rally 60% after the breakout.

Wheat is breaking out of its consolidation in a similar fashion by recording a strong weekly close above the 200 day moving average and the trend resistance. Watch this commodity with a bullish outlook by placing an intermediate term stop loss at 650 levels.

SUGAR

Symmetrical triangles are usually regarded as “continuation patterns”. This very common technical chart pattern contains at least two lower highs and two higher lows. Trend lines converge and take the symmetrical triangle shape. Though symmetrical triangles often mark a continuation of the trend, they sometimes mark major trend reversals. A safe way to analyze and trade these patterns is to wait for a valid breakout from the symmetrical triangle.

Sugar has been contracting in a range for the past one year. 200 day moving average has been flat at 25 levels and price has been volatile around the moving average. Over the past one year trend lines converged. Boundaries were at 23.60 and 28 levels. In the past one week Sugar price breached the lower boundary at 23.60 level. This could be the first signal of a multi-month downtrend and a symmetrical triangle marking a trend reversal. Intermediate/long-term technical outlook turned negative. With a stop-loss between 23.60 and 25, we can expect lower prices in the intermediate term. Unless we see the price reversing back above 23.60, negative technical outlook will remain intact.

COPPER

Copper is now closer to a major breakout. Since my last analysis on Dr. Copper on the 26th of February, price remained in a tight consolidation range without any directional movement.

http://techcharts.wordpress.com/2012/02/26/copper-2/

As price have spent more time in this congestion area with low volatility readings, a breakout in the following days should occur. The fact that copper price held above its 200 day moving average, chances of an upward breakout is higher. Though we would like to see decisive breakout in either direction for confirmation. Two important levels to watch as a support; 370 level and as a resistance 400 level.