GLOBAL EQUITY MARKETS – May 6, 2017
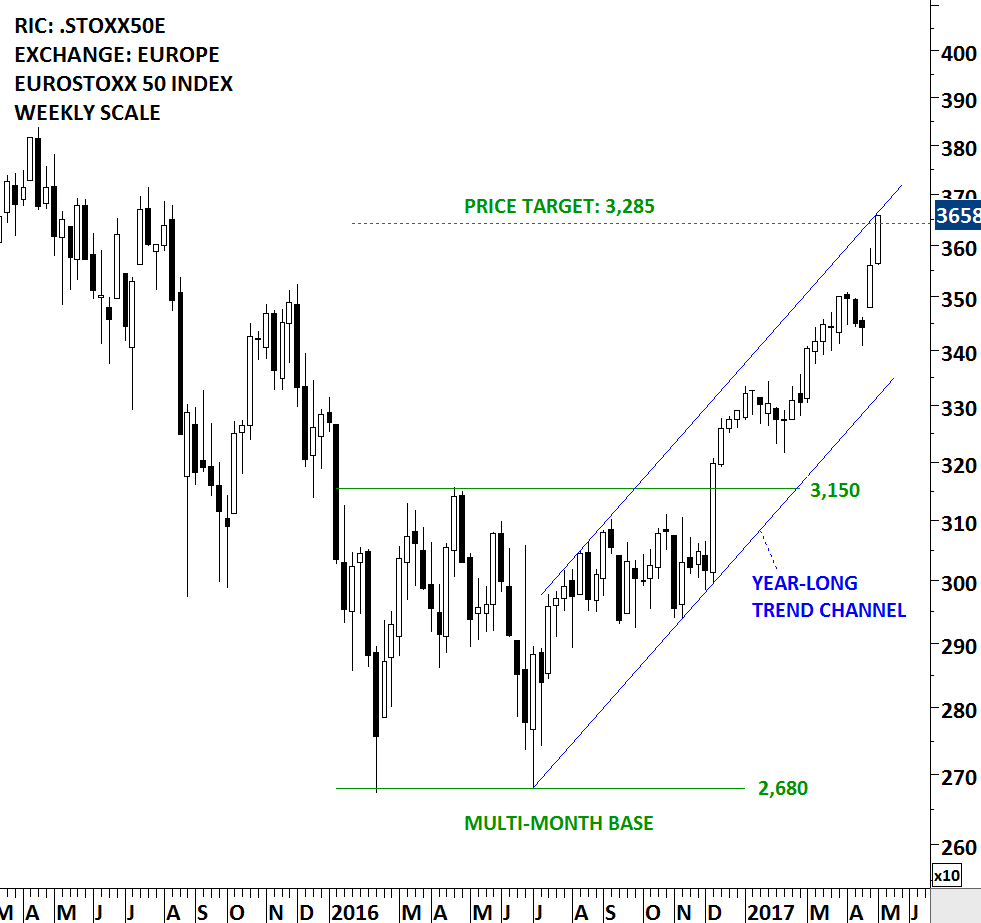
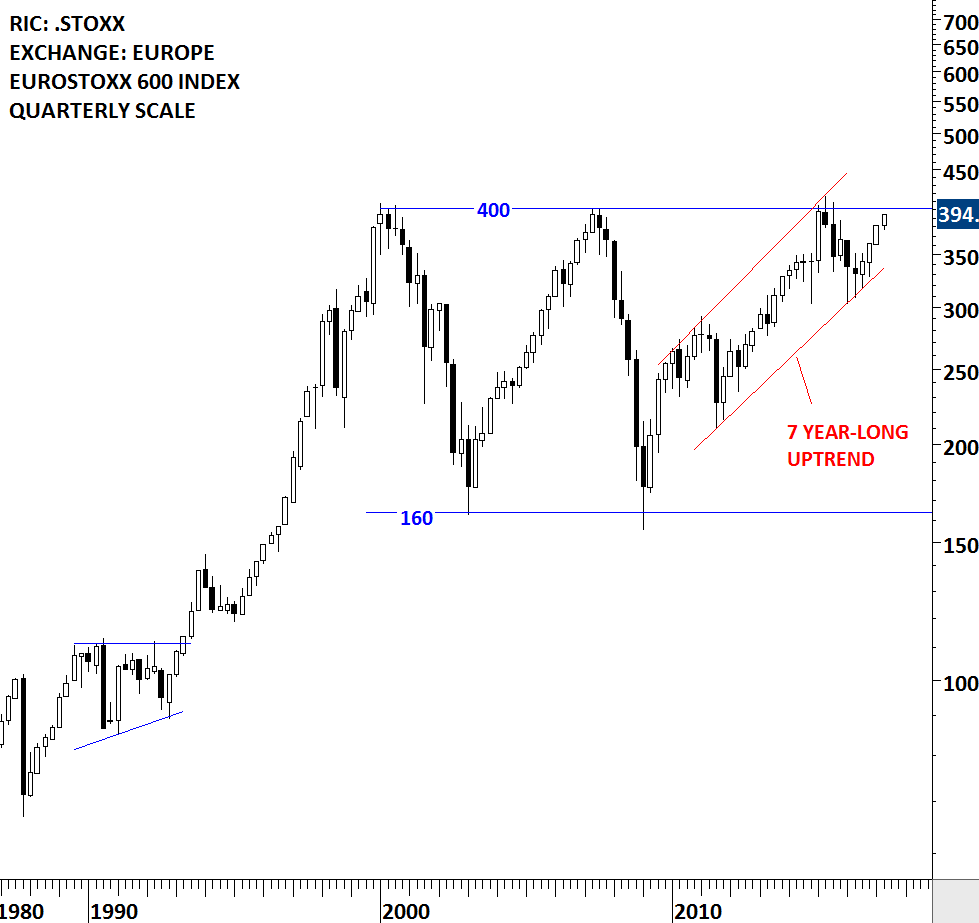
All eyes will be on the French election this weekend. The two candidates will face off in the second round on May 7. European equities have been strong since the first round election results. Two benchmark indices on Euro Stoxx 50 and Euro Stoxx 600 can put the European equity performance into perspective. Both charts show that uptrends have been intact for some time. Euro Stoxx 50 index broke out of its multi-month base in December 2016 and now very close to reaching its possible price target around 3,285 levels. The price target for the Euro Stoxx 50 Index is calculated by taking the width of the multi-month consolidation and adding it to the breakout point. 3,285-3,300 area is also the upper boundary of the parallel trend channel. On the other hand Euro Stoxx 600 Index is very close to its multi-year strong horizontal resistance at 400 levels. Both indices will face strong technical resistance in the following trading days/weeks. Performance around these strong technical resistance will shed more light on the long-term direction of the European equity performance.