Dear Tech Charts followers,
I hope you have been enjoying the weekly blog posts on Global Equity Markets. The blog posts are part of many other great analysis and educational content Tech Charts membership offers. In celebration of our 1st anniversary and a very successful year, we’re offering everyone one last opportunity to get on board the Tech Charts service at the original launch price. On June 2nd, our membership price will increase by 20%.
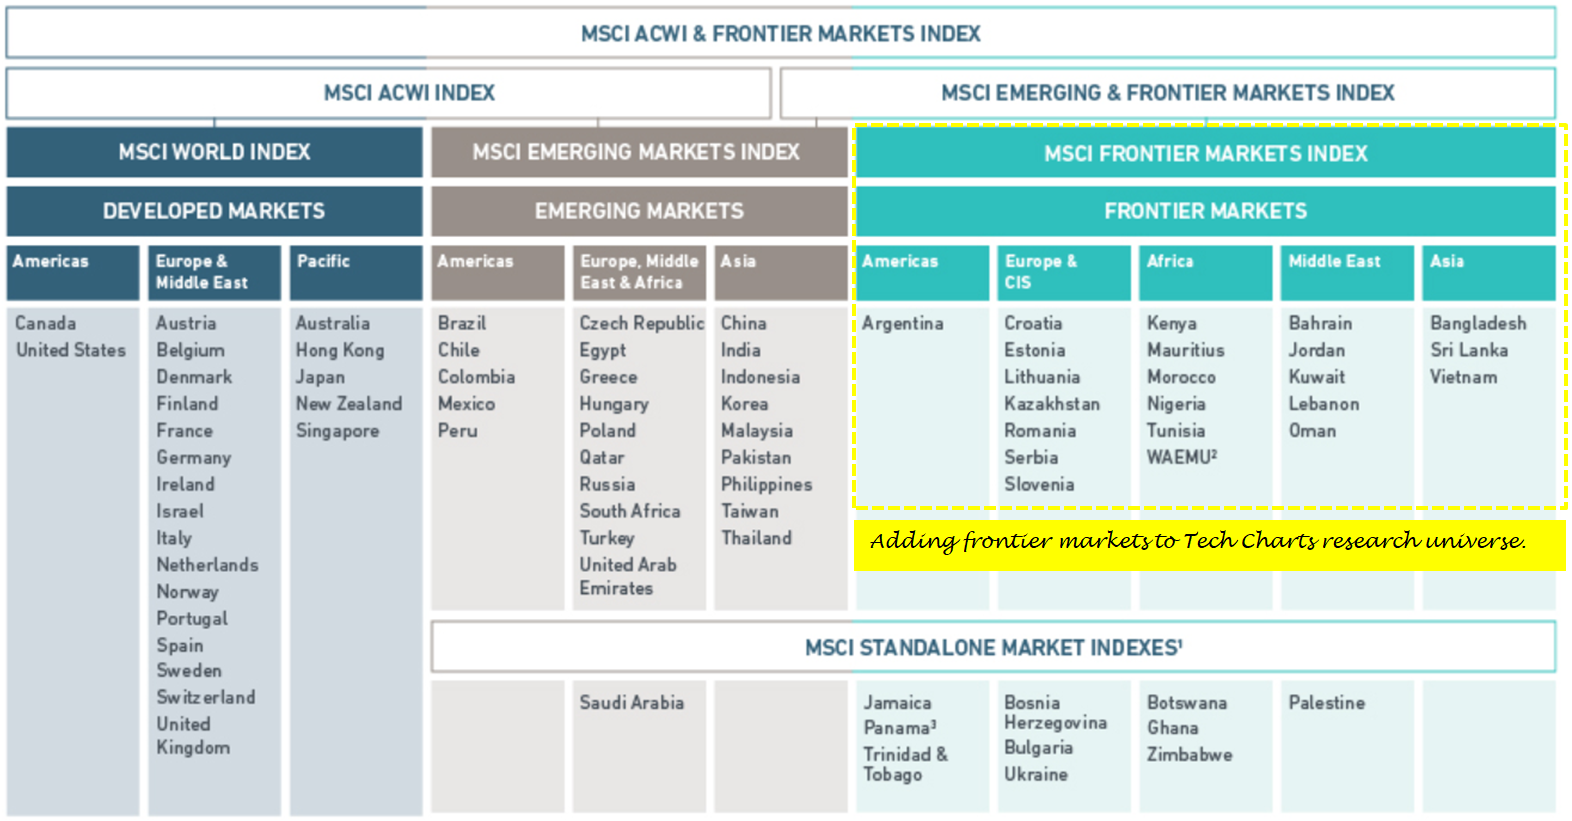
Starting from June 2nd, Global Equity Markets report will also include Frontier Market equities in its research universe. We also plan to expand our educational video tutorials that will benefit members who are new to classical charting and technical analysis. New, step by step video tutorials are being prepared on classical charting principles. I’m excited and motivated to improve our membership service every year.
I hope to build a long lasting relationship with all of our members and hope to serve you in the coming years.

<< Get access to Tech Charts at the original launch price & watch Year in Review Webinar >>
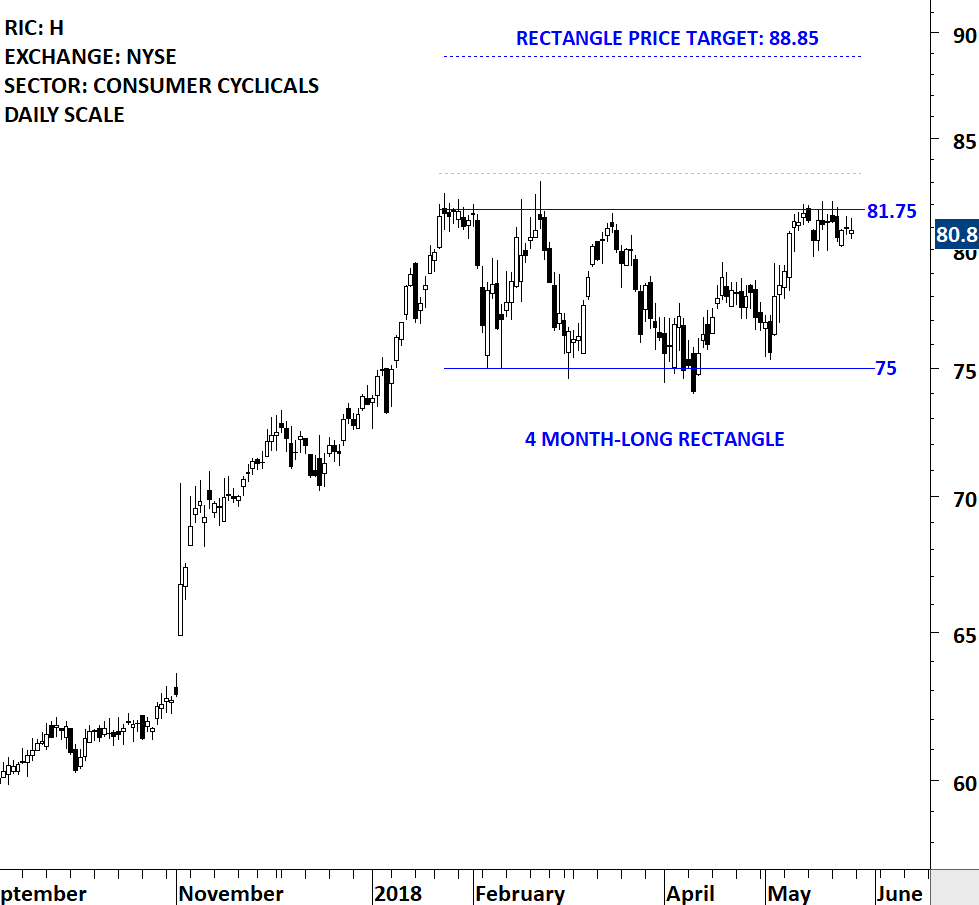
HYATT HOTELS CORP (H)
Hyatt Hotels Corporation is a global hospitality company. The Company develops, owns, operates, manages, franchises, licenses or provides services to a portfolio of properties. The Company operates through four segments: owned and leased hotels; Americas management and franchising (Americas); ASPAC management and franchising (ASPAC), and EAME/SW Asia management and franchising (EAME/SW Asia). The owned and leased hotels segment consists of its owned and leased full service and select service hotels. The Americas segment consists of its management and franchising of properties located in the United States, Latin America, Canada and the Caribbean. The ASPAC segment consists of its management and franchising of properties located in Southeast Asia, as well as China, Australia, South Korea, Japan and Micronesia. The EAME/SW Asia segment consists of its management and franchising of properties located in Europe, Africa, the Middle East, India, Central Asia and Nepal. The stock is listed on the New York Stock Exchange. Price chart formed a 4 month-long rectangle with the upper boundary acting as strong resistance at 81.75 levels. The upper boundary was tested several times over the course of the chart pattern. A daily close above 83.4 levels will confirm the breakout from the 4 month-long rectangle with the possible chart pattern price target of 88.85 levels.
<< Get access to Tech Charts at the original launch price & watch Year in Review Webinar >>