
EURO STOXX BANKS PRICE INDEX
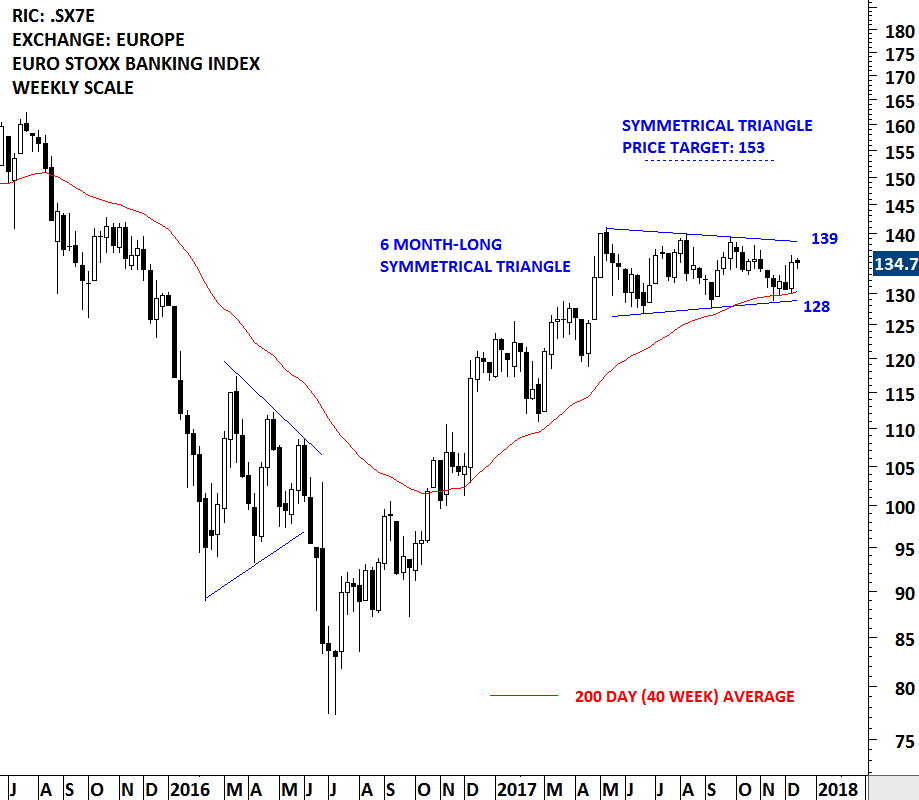
During established up trends pullback to the long-term averages are considered to be low risk entry points. A widely followed trend indicator is the 200 day moving average. Price action above the 200 day moving average is recognized as an uptrend, while price trading below the 200 day (40 week) average is considered to be a downtrend. In the last quarter of 2016, the Euro Stoxx Banking index breached its long-term average on the upside what was considered to be the beginning of a possible uptrend. Since then, each pullback found support at the long-term moving average, confirming the steady uptrend. Over the past 6 months, the Euro Stoxx Banking index formed a sideways consolidation that can be identified as a symmetrical triangle. The index remained in a tight range between 125 and 140 levels, and also pulled back to the 200 day moving average. The boundaries of the 6 month-long consolidation are forming support at 128 and resistance at 139 levels. The index found support at the lower boundary of its consolidation and the 200 day moving average. If price remains above 128 levels, we can expect a rebound towards the upper boundary at 139 levels in the coming weeks and possibly the 6 month-long symmetrical triangle to resolve on the upside confirming it as continuation chart pattern.
Tech Charts Membership

By becoming a Premium Member, you’ll be able to improve your knowledge of the principles of classical charting.
With this knowledge, you can merge them with your investing system. In fact, some investors use my analyses to modify their existing style to invest more efficiently and successfully.

As a Premium Member of Aksel Kibar’s Tech Charts,
You will receive:
-
Global Equities Report. Delivered weekly.
-
Classical charting principles. Learn patterns and setups.
-
Actionable information. Worldwide indices and stocks of interest.
-
Risk management advice. The important trading points of each chart.
-
Information on breakout opportunities. Identify the ones you want to take action on.
-
Video tutorials. How patterns form and why they succeed or fail.
-
Watch list alerts. As they become available so you can act quickly.
-
Breakout alerts. Usually once a week.
-
Access to everything (now and as it becomes available)o Reports
o Videos and video series -
Multi-part webinar course. You learn the 8 most common charting principles.
-
Webinars. Actionable and timely advice on breaking out chart patterns.
For your convenience your membership auto renews each year.


